Chapter 003: Understanding Bank Profit and Loss
Section 1: How a Bank Works Financially · Chapter 003 of 100
A product manager celebrates: her card portfolio earned 4 million in fees this quarter. Finance returns a smaller economic contribution after funding, losses, operating costs and a management capital charge. The gap is the whole of this chapter — funding costs charged through FTP, fraud and credit losses, allocated operations cost, and the capital the portfolio consumes. This chapter dissects each P&L line: how it is earned, how accounting recognises it, and how costs are attached to products honestly.
1. Chapter opening
Reading a Bank’s Balance Sheet showed the statements from the outside. This chapter opens the income engine: net interest income (the effective interest method), fee and commission income (IFRS 15 and the EIR boundary), trading income (fair value), and operating costs (what is sticky, what is allocated, what is capitalised). Along the way you will meet the balance-sheet stocks behind each flow — assets, liabilities, equity and the contingent nominal exposures that can generate income and also have recognised liabilities, provisions or assets — because no flow can be understood without its stock.
2. Learning objectives
By the end of this chapter you will be able to:
- Explain net interest income using the effective interest rate (EIR) method, including fees that adjust the yield.
- Decide whether a fee belongs in EIR (IFRS 9) or in revenue recognition (IFRS 15) using the decision logic in Figure 2.
- Describe how trading income arises and why it is volatile by construction.
- Break operating costs into staff, technology, property and other, and explain cost allocation drivers.
- Identify contingent exposures (guarantees and commitments) and recognised derivatives and the income each produces.
- Rebuild a "product profit" headline into a risk-and-cost-loaded view.
3. Business context
Income mix is strategy. A bank funded by cheap current accounts with a mortgage book may earn recurring NII but remains exposed to credit, repricing and funding risks; a markets-heavy bank earns lumpy trading income and must explain every quarter. Supervisors watch reliance on volatile income; investors pay higher multiples for recurring fees than for trading gains. Cost discipline decides who survives rate cuts: when NII compresses, only banks with structurally low cost-to-income stay profitable. Every pricing decision — loan rate, account fee, FX margin — implicitly assumes a funding cost, a loss rate, a cost allocation and a capital charge. This chapter makes those assumptions explicit.
| Strategic choice | P&L signature | Risk to watch |
|---|---|---|
| Grow mortgages fast | NII growth, applicable day-one ECL and later credit-loss changes | Concentration, underwriting standards |
| Push cards and fees | Rising fee share, stable income | Conduct risk, fee regulation caps |
| Expand trading | Volatile spikes and drawdowns | Market risk capital, valuation disputes |
| Cut branches, digitise | Restructuring charge now, lower costs later | Execution risk, customer exclusion |
| Buy a loan book | Acquisition measurement, applicable ECL treatment, then NII | Overpaying, data quality, model gaps |
4. Finance and accounting view
4.1 Net interest income and the effective interest method
Under IFRS 9, interest on an amortised-cost loan uses the effective interest rate (EIR): the rate that discounts estimated contractual cash flows, including integral fees and directly attributable transaction costs, to initial carrying amount. Expected credit losses are excluded from the ordinary EIR calculation; purchased or originated credit-impaired assets use a credit-adjusted EIR.
Fictional, fully specified bullet example: disburse 10,000, receive an integral origination fee of 300 immediately, collect annual interest of 600 at years 1 and 2 and 10,600 at year 3. Initial gross carrying amount is 9,700. Solve 9,700 = 600/(1+r) + 600/(1+r)^2 + 10,600/(1+r)^3: EIR is approximately 7.146210%. The fee is a contra adjustment to the loan asset, not a separate IFRS 15 service liability. Year-one interest is approximately 693.18, so the gross carrying amount rises by 93.18 after the 600 coupon. It reaches contractual principal at maturity. A repayment schedule with amortising principal would produce a different EIR.
Floating-rate resets normally alter the EIR for market-rate movements; a separate renegotiation may require modification accounting. Stages 1 and 2 apply ordinary EIR to the gross carrying amount; Stage 3 generally applies it to amortised cost net of allowance. Do not recognise collected interest twice if it was already accrued.
4.2 The stocks behind the flows: assets, liabilities, equity, off-balance-sheet
Every income line in Table 1 of this section is produced by a stock from Reading a Bank’s Balance Sheet:
| Flow (P&L) | Stock (balance sheet or OBS) | Key measurement note |
|---|---|---|
| Loan interest income | Loan assets at amortised cost | EIR on gross (Stages 1–2) or net (Stage 3) balance |
| Deposit interest expense | Deposit liabilities | Accrue using contractual cash flows and the liability EIR; FTP is a separate internal management allocation |
| Financial guarantee income | Recognised guarantee liability plus contingent nominal exposure | IFRS 9 initial fair value; subsequently higher of ECL and initial amount less cumulative income recognised under IFRS 15 principles, unless an exception applies |
| Undrawn-commitment fees | Off-balance-sheet commitments | EIR if drawdown likely, otherwise assess the distinct commitment service and recognise revenue as it is provided (Figure 2) |
| Trading gains | Derivatives/securities at FVTPL | Full fair value move each period |
| Dividends | Equity investments | When the right to receive is established |
| Operating costs | Right-of-use assets, intangibles, provisions | Depreciation (IFRS 16), amortisation (IAS 38), IAS 37 charges |
Off-balance-sheet exposures deserve emphasis because beginners ignore them: a 500 guarantee portfolio may show almost no balance-sheet footprint (an applicable guarantee liability) while earning 5 in annual fees and carrying genuine credit risk; a financial-guarantee liability follows its applicable IFRS 9 higher-of measurement, alongside nominal and prudential measures (Commitments and Financial Guarantees, Risk-Adjusted Returns and Pricing and Risk-Weighted Assets).
4.3 Fee and commission income (IFRS 15 boundary)
Revenue is recognised when (or as) the service is delivered: account maintenance monthly, card interchange per transaction, advisory on deal completion, custody fees over the service period. The hard part is the boundary: fees integral to lending (arrangement, origination) adjust EIR under IFRS 9; fees for distinct services (syndication, advice, brokerage) follow IFRS 15; commitment fees depend on expected drawdown. Figure 2 gives the decision tree BAs encode into product-approval checklists.
4.4 Trading income and fair value
Trading income = realised gains/losses + unrealised fair-value moves + related interest/dividends on trading positions. By construction it is volatile: a 100 bond portfolio moving 1% creates 1 of income with no cash changing hands. Valuation control (independent price verification, prudent valuation adjustments) exists precisely because traders' marks feed their own P&L — a conflict the control framework must neutralise (Chapters on fair value and audit).
4.5 Operating costs: the sticky half of profit
| Cost block | Contents | Behaviour | Accounting notes |
|---|---|---|---|
| Staff | Salaries, bonuses, pensions, share-based pay | Largest; slow to adjust | IAS 19 pensions; IFRS 2 share awards; bonuses accrued through the year |
| Technology | Data centres, licences, cloud, change programmes | Growing share | Capitalise only qualifying development (IAS 38); rest is expense |
| Property and equipment | Branches, HQ, depreciation | Falling with digitisation | IFRS 16 leases on balance sheet; restructuring provisions under IAS 37 |
| Other admin | Legal, consulting, marketing, regulatory levies | Mixed | Bank levies and deposit-guarantee contributions (IFRIC 21 timing) |
Headline cost-to-income flatters banks that under-invest: cutting IT spend improves this year's ratio and damages next decade's. Analysts therefore read cost composition and trend, and supervisors assess whether cost-cutting impairs controls (a standing Board question).
5. Product and customer impact
Pricing connects directly: loan rate ≈ funding cost (FTP) + expected loss + operating cost allocation + capital charge + margin. When customers complain "fees keep rising," the driver is often NII compression forcing cross-subsidy from fees — visible in segment reporting. Fee caps (for example on interchange or overdraft charges, jurisdiction-dependent) flow straight to product P&L and trigger repricing elsewhere. Chargebacks and fraud losses sit between fee income and impairment depending on policy — testers must confirm the classification, because it moves both product dashboards and regulatory templates.
6. Regulatory and supervisory view
Supervisors dissect income quality: FINREP breaks income into interest, fees, trading and other with segment detail (The Regulatory Reporting Landscape); stress tests haircut volatile income first; the Fundamental Review of the Trading Book polices the trading/banking-book boundary that decides capital treatment (Risk-Weighted Assets). Conduct regulators separately police fee fairness — mis-sold fee products have produced industry-wide redress bills that dwarf the original income. Bonus regulation links staff cost to risk (deferrals, malus/clawback), so remuneration disclosure is a Pillar 3 item (Pillar 3 Disclosures).
7. Systems and data view
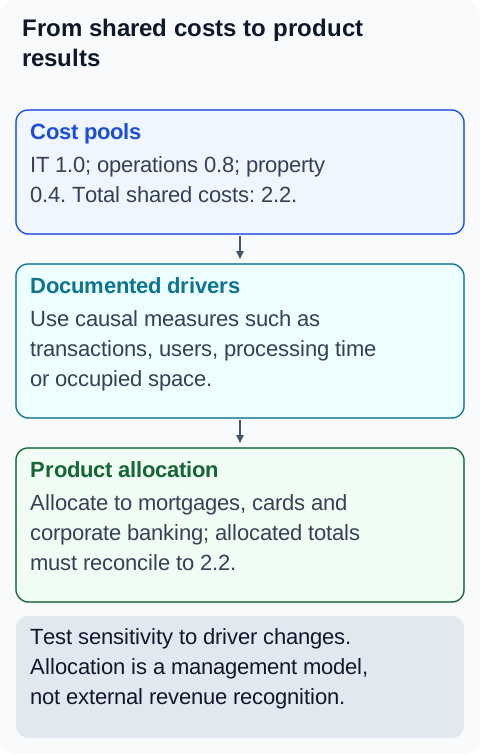
Income engines live in different systems that must agree: the loan system computes EIR accruals daily; the fee engine posts per-transaction revenue with product and channel dimensions; the treasury platform revalues trading books and posts fair-value moves; the HR and procurement systems feed staff and vendor costs; the allocation engine spreads central costs to products using drivers (accounts, transactions, revenue, headcount). The two classic breaks: fee postings missing dimensions (income lands in "unallocated" and segment reports mislead), and EIR recalculation failures after loan amendments (income recognised on stale schedules).
8. End to end process
Month-end income close for one product line: (1) freeze transaction feeds at cut-off; (2) run EIR accruals, fee sweeps and fair-value revaluations; (3) post FTP funding charges/credits so product NII is shown after funding cost; (4) run the cost-allocation engine and validate driver inputs; (5) book ECL and provision charges; (6) reconcile product subledger totals to GL and investigate breaks; (7) produce product P&L with prior-period variance commentary; (8) lock, attest and publish to management reporting, then feed FINREP. Steps 3 and 4 are where "headline vs true profit" diverges — and where the worked example below is built.
9. Controls and risks
| Risk | Control | Evidence |
|---|---|---|
| Income recognised early (fees, trading) | Cut-off rules, independent valuation, deal-confirmation matching | Cut-off testing, price-verification reports |
| EIR errors after amendments | Amendment-triggered recalculation workflow, engine regression tests | Recalculation logs, UAT evidence |
| Cost misallocation hiding loss-makers | Approved driver methodology, annual driver review | Allocation policy, driver sign-off |
| Capitalised costs that should be expense | IAS 38 criteria checklist, stage-gate approvals | Capitalisation papers, impairment tests |
| Manual top-side adjustments | Threshold approval, expiry review, audit trail | Adjustment log with business rationale |
10. Practical examples
Example A — True profit rebuild (fictional). Card portfolio, one quarter (millions): interchange and fees +4.0; FTP funding charge −0.6; fraud and credit losses −0.9; allocated operations −1.2; capital charge (12% hurdle on allocated capital) −0.5; tax effect −0.24. Statutory-style pre-tax contribution is 4.0 − 0.6 − 0.9 − 1.2 = 1.3. With an illustrative tax charge of 0.24, post-tax contribution is 1.06; deduct the 0.5 management capital charge to obtain economic profit of 0.56. The tax amount is an assumption, not a tax computed after deducting the capital charge. Each deduction maps to a system and an owner — that mapping is the BA's deliverable.
Example B — The fee that moved. A 2.0 syndication fee is booked to fee income on signing; policy says it is a distinct service delivered at financial close, one month later. Month-end cut-off adjustment moves 2.0 between periods. Small amount, but the external auditor extrapolates cut-off discipline across all fees — one slip invites a wider finding.
11. Diagrams
Figure 1. Bank income and expense rulebooks.
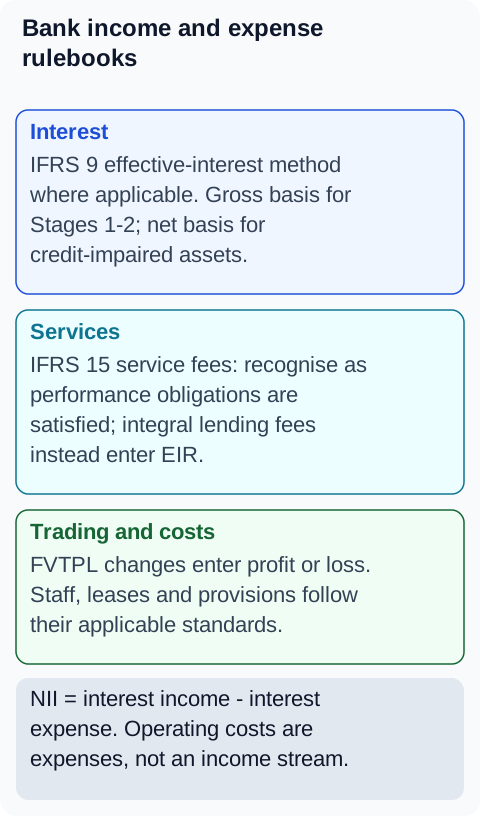
Figure 2. Which fee recognition model applies?
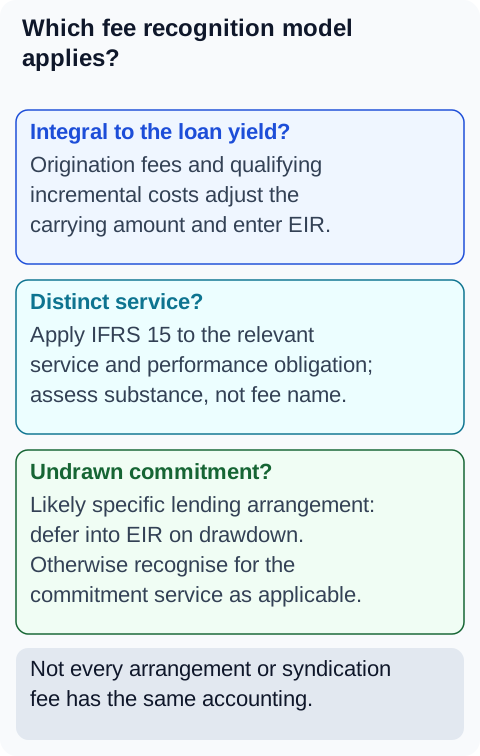
Figure 3. From shared costs to product results.
12. Tables
Table 1 — Income line diagnostic questions
| Line | Ask first | Then ask |
|---|---|---|
| Net interest income | Is growth from volume, margin or mix? | What happens if rates fall 2%? |
| Fee income | Recurring or one-off (advisory spikes)? | Are fees exposed to conduct/regulatory caps? |
| Trading income | Share of total income? | Who verified the marks? |
| Operating costs | Which block is growing fastest? | Is investment being expensed or capitalised correctly? |
| Impairment | Cost of risk vs history? | Stage 2 migration trend (Section 9)? |
Table 2 — Where income hides off the balance sheet
| Exposure | Footprint on balance sheet | Income | Risk charge |
|---|---|---|---|
| Financial guarantee | Recognised liability, not provision-only | Release of guarantee income over coverage, subject to measurement | ECL measurement, credit RWA and large-exposure treatment where applicable |
| Undrawn commitment | Provision on ECL | Commitment/EIR fee | Credit conversion factor → RWA |
| Derivative receivable | Fair value asset | Trading income moves | Counterparty credit RWA, collateral flows |
| Custody / servicing | Often nothing | Servicing fees | Operational risk, conduct risk |
13. Illustrative bank case study
When fee income became a liability. A large retail bank's fee income was flattered for years by charges later judged unfair — payment-protection-style add-ons and opaque overdraft fees. Redress and fines ultimately exceeded a decade of the original income, restated prior years, and forced product redesign under supervisory scrutiny. The finance lessons: income quality matters more than income level; conduct risk is a P&L risk with multi-year tails; and provisions for redress (IAS 37) must be recognised as soon as the obligation is probable and estimable — delay compounds the damage. (Fictional training case; no specific bank or event is asserted.)
14. BA, developer, tester and operations guidance
- BA: For every new fee or product, document the recognition trigger, timing, EIR-vs-IFRS-15 classification, dimensions, reversal rules and the affected FINREP lines — get Finance sign-off before build.
- Developer: Drive accruals from engine-calculated schedules, not screen inputs; emit events for amendments so EIR recalculates; never let fee postings succeed without mandatory dimensions (fail to exceptions instead).
- Tester: Seed loans with upfront fees, partial prepayments, rate resets and amendments; independently recompute EIR schedules in a spreadsheet and tie engine output to the penny; test cut-off with backdated transactions.
- Operations: Monitor unallocated income/cost buckets daily — growth means dimensions are breaking upstream; chase owners, don't just reclassify.
15. Common mistakes
- Booking integral loan fees as immediate fee income instead of spreading via EIR.
- Treating trading gains as recurring core income in forecasts and pricing.
- Reading product profit before FTP, losses, allocations and capital charges.
- Capitalising project costs that fail IAS 38 criteria to flatter current-year costs.
- Forgetting OBS exposures because "they're not on the balance sheet."
16. Key takeaways
- NII accrues by EIR; fees follow service delivery; trading follows fair value — three different clocks.
- The EIR-vs-IFRS-15 boundary decides when fee income hits profit; get it wrong and periods misstate.
- Costs reach products only through allocation drivers — interrogate the drivers before trusting product profit.
- Guarantees and commitments create contingent exposure; financial guarantees also have recognised liabilities, while derivatives are recognised at fair value and create further counterparty exposure.
- Economic profit deducts a management capital charge from a consistently defined post-tax contribution; that charge is not normally a statutory expense.
17. References and verification notes
-
IFRS Foundation: IFRS 9: classification depends on business model and contractual cash flows; initial recognition and directly attributable costs follow IFRS 9. This is the IFRS track, not US GAAP CECL.
-
IFRS 9 (EIR, amortised cost, ECL), IFRS 15 (revenue from contracts with customers), IFRS 13 (fair value), IFRS 16 (leases), IAS 37 (provisions), IAS 38 (intangibles) — verify the endorsed version applicable to the reporting period and jurisdiction.
-
Fee-cap, interchange and conduct rules are jurisdiction-specific (for example EU interchange caps, national overdraft rules, RBI fee guidelines in India); confirm current local requirements before product work.
-
Numbers are fictional training simplifications; EIR mechanics are expanded with full schedules in Effective Interest Rate and Amortised Cost.