Chapter 004: Profit, Cash, Liquidity and Capital
Section 1: How a Bank Works Financially · Chapter 004 of 100
A bank reports record profit on Friday and fails the following Thursday. Impossible? It happened — repeatedly, in different countries, under different rules. Each time, the autopsy shows the same confusion: profit was mistaken for cash, cash for liquidity, and liquidity for capital. This chapter separates the four concepts permanently, shows how they interact through worked numbers, and explains why finance must manage all four at once.
1. Chapter opening
Chapters 001–003 built the income engine and the statements. This chapter adds the three constraints that bind it: cash reality (money must actually move), liquidity survival (outflows must be payable under stress), and capital adequacy (losses must be absorbable). You will learn the mechanics of each, the ratios that govern them, and the trade-offs between them — because liquid assets may earn interest and equity funds assets; the trade-off is their yield, funding cost and required return.
2. Learning objectives
By the end of this chapter you will be able to:
- Reconcile a profit figure to operating cash flow, naming the five standard adjustments.
- Explain LCR and NSFR in plain language, including what counts as HQLA and stable funding.
- Explain CET1, AT1 and Tier 2 capital and the role of risk-weighted assets.
- Show how dividends, losses and balance-sheet growth move the CET1 ratio in opposite directions.
- Describe the profit–liquidity–capital triangle trade-off behind pricing and strategy decisions.
- List the early-warning indicators that distinguish a profitable-but-fragile bank.
3. Business context
Different stakeholders optimise different lenses, and the tension is structural: shareholders want dividends and ROE (profit lens); treasurers hoard buffers (liquidity lens); supervisors demand capital (safety lens); operations just needs today's payments to settle (cash lens). Strategy is the negotiated settlement: how much low-yield HQLA to hold, how much profit to retain versus distribute, how fast to grow risk-weighted assets. Misunderstanding any lens produces classic failures — profitable banks that cannot pay (liquidity), cash-rich banks that cannot lend (capital-constrained), liquid banks that cannot absorb losses (thin equity).
| Failure mode | Profit | Cash/Liquidity | Capital | Historical pattern |
|---|---|---|---|---|
| Funding run | Positive | Collapses | Adequate initially | Wholesale-funded mortgage banks, 2007–08 |
| Slow credit bleed | Eroding | Adequate | Eroded over years | Concentrated commercial-real-estate lenders |
| Trading shock | Sudden loss | Margin calls drain cash | Breaches buffers | Leveraged markets-heavy firms |
| Dividend over-distribution | Paid out | Fine | Left thin for the downturn | Pre-crisis distributors needing state rescue |
4. Finance and accounting view
4.1 From profit to cash: the reconciliation
The bank cash flow statement (IAS 7, direct or indirect method) may use the direct method to show cash receipts/payments or the indirect method to start from profit and adjust:
| Adjustment | Direction | Banking example |
|---|---|---|
| Non-cash charges added back | + | Impairment (ECL provision, no cash moves), depreciation |
| Accrued-but-unreceived income removed | − | Interest accrued but not yet paid by borrowers |
| Cash lent out | − | External cash advances to customers are normally operating cash flows for a financial institution; an internal account credit is non-cash |
| Cash received from borrowers | + | Principal repayments |
| Deposit inflows/outflows | +/− | Customer deposits are operating cash flows for a bank |
| Fair-value moves without settlement | +/− | Unrealised trading gains removed; only settled cash counts |
Worked mini-reconciliation (fictional, millions): Net profit 975 → add back impairment 500 and depreciation 120 → subtract net external cash advances to customers 6,000 (assume no non-cash movements in that figure) → add deposit inflow 5,500 → adjust for accruals and working capital −300 → operating cash flow ≈ 795. In this example profit is 975 and operating cash flow is 795. In other growth scenarios, external loan advances can create a much larger difference; the funding and settlement assumptions determine it. Analysts who value banks on earnings alone miss this.
4.2 Liquidity: surviving the run
Liquidity risk is the risk of being unable to meet outflows when due — intraday, 30 days, one year. Two Basel ratios anchor supervision (full treatment in Section 16):
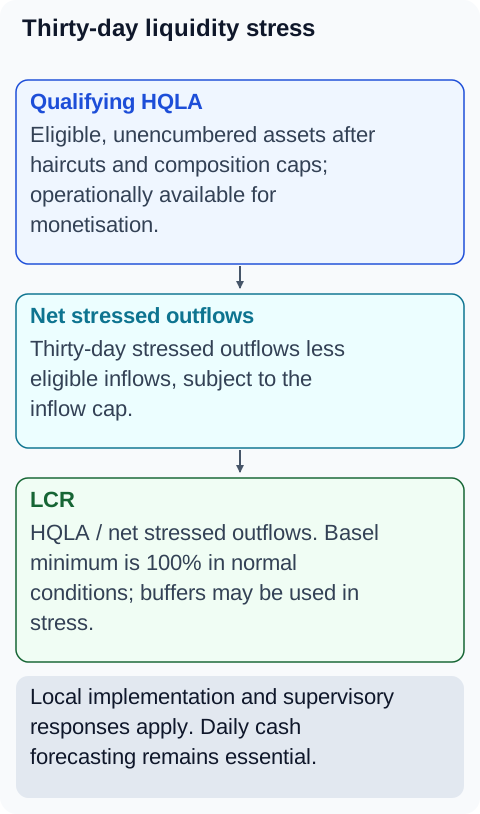
- Liquidity Coverage Ratio (LCR) = High-Quality Liquid Assets ÷ net stressed cash outflows over 30 days ≥ 100%. HQLA means assets reliably saleable or repo-able in stress: cash, central bank reserves, top-rated government bonds (with haircuts). Stressed outflows assume run-off rates per liability type (stable and less-stable retail deposits have different factors; eligibility, deposit insurance and local implementation determine the rate).
- Net Stable Funding Ratio (NSFR) = available stable funding ÷ required stable funding over one year ≥ 100%. Assets require weighted stable funding; this does not require matching every 25-year mortgage with a 25-year liability.
Worked LCR sketch (fictional): HQLA 18,000; stressed outflows 25,000; stressed inflows (capped) 9,000 → net outflows 16,000 → LCR = 112.5%. This provides limited headroom under the assumptions, which may shrink if wholesale maturities cluster inside the window, which is why maturity ladders, not just the ratio, are monitored daily.
Intraday liquidity (settling payments each day, posting collateral on time) is the third, often-forgotten layer — a bank can pass LCR and still default on a payment deadline (Chapter on intraday liquidity).
4.3 Capital: absorbing the unexpected
Capital exists for unexpected loss; expected loss is priced and provisioned (Section 9). The stack, from strongest to weakest:
| Tier | Instruments | Loss absorption | Key notes |
|---|---|---|---|
| CET1 (Common Equity Tier 1) | Ordinary shares, retained earnings, some reserves | Going-concern, first to absorb | Deductions: goodwill, intangibles, some DTAs, shortfalls (Accounting Equity versus Regulatory Capital) |
| AT1 (Additional Tier 1) | Eligible perpetual instruments, including qualifying preferred shares or contingent-convertible instruments | Going-concern via conversion/write-down triggers | Coupons discretionary and non-cumulative |
| Tier 2 | Dated subordinated debt | Gone-concern (in resolution) | Amortises out of eligibility near maturity |
| Buffers above minima | Conservation, countercyclical, systemic buffers in CET1 | Restrict distributions when breached | Applicable local buffer/distribution rules determine restrictions, including MDA where that framework applies |
The CET1 ratio = CET1 ÷ risk-weighted assets. RWAs weight each exposure by riskiness (risk weights depend on the applicable implementation, exposure class, collateral and loan-to-value or other risk drivers — Risk-Weighted Assets). So the ratio moves on both sides: retain profit → numerator up; grow risky lending → denominator up faster.
Worked interaction (fictional): CET1 7,050, RWAs 58,000 → ratio 12.2%. The bank pays 400 dividends (CET1 → 6,650) and grows corporate lending adding 4,000 RWAs (→ 62,000). New ratio: 6,650/62,000 = 10.7% — a 1.5-point fall from growth plus distribution combined. This single arithmetic drives capital planning, dividend policy and lending appetite (Capital Adequacy and Planning).
4.4 The triangle trade-off
| Decision | Profit effect | Liquidity effect | Capital effect |
|---|---|---|---|
| Hold more HQLA | Drag (low yield) | Stronger LCR | Neutral/slightly positive (low RWA) |
| Grow corporate loans | Higher NII | Consumes stable funding | Higher RWAs dilute CET1 |
| Pay special dividend | Neutral short-term | Cash leaves | CET1 falls immediately |
| Issue qualifying equity-classified AT1 | Discretionary distributions are generally equity movements, not P&L interest | Cash in | Improves Tier 1 and total capital, not CET1; eligibility and accounting classification are separate |
| Sell a loan portfolio | Gain/loss relative to carrying amount | Cash received if sale settles | RWAs may fall; a sale loss also reduces CET1, so net ratio effect must be calculated |
Decisions can improve several measures together, but material balance-sheet choices need joint analysis — this is why ALCO (Asset-Liability Committee) exists: to arbitrate the triangle with numbers, not slogans.
5. Product and customer impact
Customers meet the triangle as availability and price: mortgage approvals slow when NSFR binds; savings rates fall when the bank is comfortably liquid; loan margins rise when capital is scarce; overdraft facilities get cut before downturns because undrawn commitments consume liquidity and capital (credit conversion factors). Deposit insurance limits and resolution planning (MREL/TLAC) shape which products the bank promotes — "sticky" insured retail deposits are balance-sheet gold, so banks pay for them with better rates and features.
6. Regulatory and supervisory view
Each lens has its supervisory home: profit quality in financial reporting and audit (FINREP, external audit); cash in the cash flow statement and intraday monitoring; liquidity in LCR/NSFR reporting, ILAAP and stress testing (Section 16); capital in COREP, ICAAP, SREP and buffers (Section 15). Under EU/UK-style frameworks, relevant distributions can face Maximum Distributable Amount restrictions when the applicable buffer requirements are not met. Other jurisdictions use their own restriction rules; assess the actual legal requirement before paying. Supervisors can also impose Pillar 2 add-ons for risks the standard ratios miss, making the "real" requirement bank-specific.
7. Systems and data view
Four different data machines feed the four lenses from shared sources: the GL and subledgers (profit), payment and settlement systems plus cash-flow forecasting (cash/liquidity), treasury and collateral systems with maturity ladders (LCR/NSFR), and risk engines computing RWAs and capital (CET1). The standing reconciliation: treasury's cash positions vs GL cash, risk's exposure totals vs finance's loan balances, reported ratios vs underlying marts. BCBS 239 principles (accuracy, integrity, completeness, timeliness) apply to risk and liquidity data explicitly — a failed reconciliation here is a supervisory finding, not an IT ticket (Section 20).
8. End to end process
A dividend decision as the four-lens integration test: (1) close the quarter's profit and attest it; (2) confirm cash and liquidity forecasts survive the payout under stress (treasury sign-off, LCR/NSFR pro forma); (3) compute pro forma CET1 with buffers and MDA headroom (risk/finance sign-off); (4) check large-exposure, leverage and resolution-entity constraints; (5) board proposal with all four lenses on one page; (6) supervisory notification or approval where required; (7) pay, post, disclose, and feed the next planning cycle. Any lens flashing red stops the payment — that is the control working.
9. Controls and risks
| Risk | Control | Evidence |
|---|---|---|
| Over-distribution weakening capital | MDA calculation, buffer monitoring, board attestation | Pro forma capital pack, minutes |
| LCR window-dressing (month-end only) | Daily averaging, intraday monitoring, independent reporting | Daily LCR series, breach log |
| RWA optimisation gaming | Model validation, supervisory approval, output floor awareness | Validation reports, approvals |
| Cash-forecast failure | Daily nostro/treasury reconciliation, forecast back-testing | Forecast-vs-actual reports |
| Siloed lenses (each team optimises its own) | ALCO with joint pack and decision log | ALCO minutes, limit framework |
10. Practical examples
Example A — Growth eats the ratio. A bank grows loans 15% funded by wholesale deposits. Profit rises 10% (cheered), LCR falls to 101% (amber), CET1 falls 0.8 points (amber), NSFR breaches 100% (red). The growth was profitable, unaffordable and non-compliant simultaneously — ALCO's job is to say so before, not after.
Example B — Cash vs profit in one transaction. A bank sells a 1,000 loan portfolio at a 50 discount. P&L: 50 loss today. Cash: +950 immediately. Liquidity: cash increases by 950; LCR/NSFR effects depend on the original asset, inflow rules and use of proceeds. Capital: RWAs may fall but the 50 loss also reduces CET1; the ratio can improve or deteriorate. Four lenses, four answers — all correct, each incomplete alone.
11. Diagrams
Figure 1. Four financial lenses.
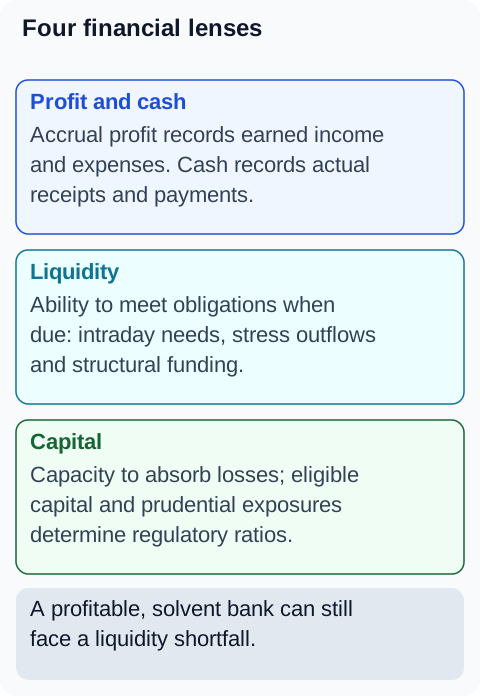
Figure 2. Retained profit and prudential capital.
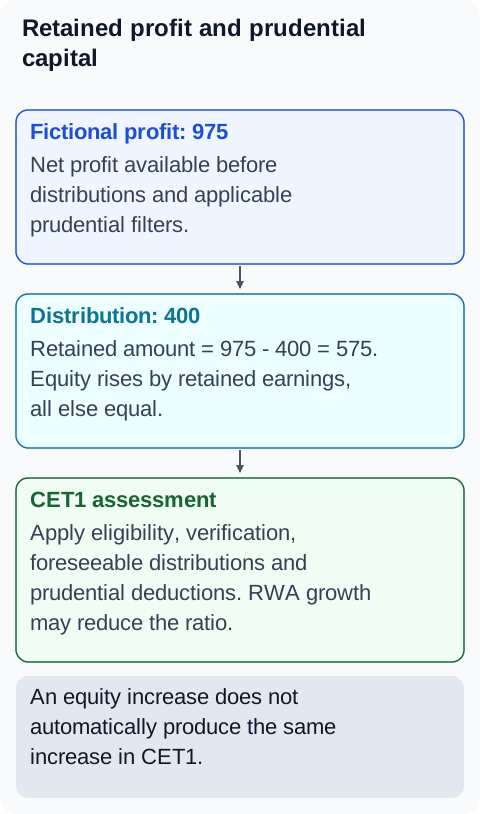
Figure 3. Thirty-day liquidity stress.
12. Tables
Table 1 — The four lenses side by side
| Lens | Statement/ratio | Frequency | Owned by | Fails as |
|---|---|---|---|---|
| Profit | P&L, NIM, ROE | Monthly/quarterly | Business lines + Finance | Losses erode equity |
| Cash | Cash flow statement | Daily forecast | Treasury + Operations | Missed settlement |
| Liquidity | LCR, NSFR, ILAAP | Daily/monthly | Treasury, ALCO | Run, funding freeze |
| Capital | CET1, leverage, ICAAP | Quarterly + planning | Risk + Finance, Board | Insolvency, resolution |
Table 2 — Early warnings of profitable-but-fragile
| Signal | Where spotted | Chapters |
|---|---|---|
| Loan growth far above deposit growth | Balance sheet, LDR | 002, 021 |
| Wholesale funding share rising | Funding mix, maturity ladder | 021, 046–047 |
| LCR/NSFR trending to minimum | Treasury pack | 046–047 |
| CET1 buffer thinning while dividends rise | Capital plan, MDA headroom | 045, 071–075 |
| Stage 2 loans rising while impairment flat | Asset quality notes | 031–034 |
| Unallocated/suspense balances growing | Reconciliation pack | 019–020 |
13. Illustrative bank case study
A profitable bank faces a refinancing gap. In this fictional case, a mortgage lender reports positive accrual profit but depends on short-term wholesale funding. Loss of refinancing access produces a cash shortfall at the next maturity. Treasury tests collateral eligibility, actual monetisation time, currency availability and contingency sources; Finance separately assesses valuations, going concern and capital. LCR and NSFR complement these controls, but neither guarantees that a bank cannot fail.
14. BA, developer, tester and operations guidance
- BA: Any business case must show all four lenses pro forma — profit, cash/liquidity impact, RWA/capital impact. A case showing only revenue is incomplete by design; send it back.
- Developer: Ratio engines must use frozen, versioned inputs and show their work (numerator, denominator, adjustments). Never compute LCR/CET1 from live mutable tables mid-close.
- Tester: Recompute LCR and CET1 from source extracts with independent spreadsheets; test boundary portfolios (exactly 100%, buffer thresholds, MDA triggers) and maturity-ladder edge dates.
- Operations: Daily liquidity and cash reconciliations are survival controls — escalate breaks same-day; aged breaks in cash/nostro need treasury eyes, not just ops queues.
15. Common mistakes
- Calling a profitable bank "safe" without checking funding and capital.
- Treating LCR ≥ 100% as comfort without reading the maturity ladder and intraday position.
- Forgetting RWA growth when celebrating loan-growth-driven profit.
- Approving distributions from accounting profit without MDA and stress checks.
- Managing each lens in a different team with no joint ALCO arbitration.
16. Key takeaways
- Profit follows accrual recognition and measurement; cash flow records cash and cash-equivalent movements; liquidity is survival capacity; capital is loss-absorption strength.
- Lending growth consumes cash and capital while creating future profit — the timing mismatch rules banking.
- LCR tests 30-day stressed cash outflows; NSFR tests the prescribed structural funding profile over a one-year horizon. NSFR is not a one-year cash-survival test.
- CET1 ÷ RWAs moves on both sides; dividends and growth both dilute it.
- ALCO evaluates the combined profit, liquidity and capital effects of material balance-sheet decisions.
17. References and verification notes
-
Basel Framework: NSFR: available and required stable funding are weighted by funding and asset characteristics over a one-year horizon, not a requirement to match every mortgage with equally long funding.
-
Basel Framework: LCR: 100% is the minimum in normal conditions for covered banks; HQLA buffers are intended to be usable in stress. Basel is a standard implemented through local law.
-
IFRS Foundation: IAS 7: cash-flow reporting is distinct from accrual profit; non-cash transactions are excluded from cash flows.
-
IAS 7 (cash flows), Basel LCR/NSFR standards (BIS), CRR/CRD implementation in the EU, PRA liquidity rules in the UK, RBI liquidity frameworks in India, US liquidity rules (LCR/NSFR for large banks) — calibrations, run-off rates and scope thresholds are jurisdiction- and entity-specific; verify current rules before use.
-
Capital stack and buffer mechanics are introduced here and defined fully in Section 15; MDA restrictions depend on the combined buffer requirement in force.
-
All numbers are fictional training simplifications; never use them for real ratio computation.