Chapter 081: The Regulatory Reporting Landscape
Section 17: Regulatory Reporting Foundations and Delivery · Chapter 081 of 100
One loan appears in FINREP (asset quality), COREP (capital), AnaCredit-style loan-level data, statistical returns, Pillar 3 (public), stress tests and the annual report — seven masters, one truth. Regulatory reporting is the controlled production of every external data demand from governed lineage. This chapter maps the landscape: who demands what, why, how often, and what happens when it's wrong.
1. Chapter opening
Reporting families include prudential capital and liquidity returns, financial information, central-bank statistics, resolution data, public disclosures and ad-hoc requests. They use different legal perimeters, definitions and reporting dates. European FINREP has both IFRS and national-GAAP reporting arrangements where applicable; it is not universally an IFRS-only return. Maintain the legal basis, applicability, reporting frequency, format, deadline and channel for each obligation. Do not infer a bank's return count, staffing or cost from an unsupported industry average.
2. Learning objectives
- Name the five reporting families with one example return each.
- Explain why one exposure appears differently across families (scope/measure/timing).
- State submission consequences (fines, findings, distribution restrictions, reputation).
- Describe the reporting calendar (daily → annual) with ownership.
- Explain ad-hoc vs recurring demands and surge capacity planning.
3. Business context
Reporting needs accountable preparation, review, validation, submission and correction. Requirements evolve: amendments can add, remove or simplify returns, so do not assume the burden always increases. Maintain surge capacity for close and examinations, and assess each change against actual legal scope, data needs and delivery deadlines. A late filing or source error requires proportionate escalation; it does not mechanically produce a fine or Pillar 2 add-on in every case.
| Family | Example | Frequency | Failure cost |
|---|---|---|---|
| Prudential | COREP capital | Typically quarterly; template-specific | Findings, add-ons |
| Financial | FINREP | Frequency depends on applicable template and scope | Restatement, audit issues |
| Statistical | Balance-sheet stats | Monthly | Fines, data orders |
| Resolution | MREL/liability data | Annual + ad-hoc | Resolution-plan failure |
| Disclosure | Pillar 3 | Quarterly/annual | Market punishment |
4. Finance and accounting view
4.1 Same loan, seven lenses (fictional 10m corporate loan)
For a fictional 10m corporate loan with 0.3m allowance, the accounting net balance is 9.7m. FINREP captures gross carrying amount, allowance, stage and asset-quality flags in their prescribed places. If the applicable standardised capital treatment uses 9.7m exposure after specific provisions and a 100% risk weight, RWA is 9.7m; document any prudential exposure-value difference. Under IRB, PD × LGD × EAD estimates expected loss, not RWA: the prescribed capital function, maturity and other adjustments determine risk-weighted exposure. Statistical reporting adds sector and maturity attributes. Resolution analysis asks whether the bank's lending service supports a critical economic function; this is not determined by whether the borrower supplies services to the bank. Public Pillar 3 reports aggregated portfolios rather than individual borrower detail.
4.2 Calendar and ownership
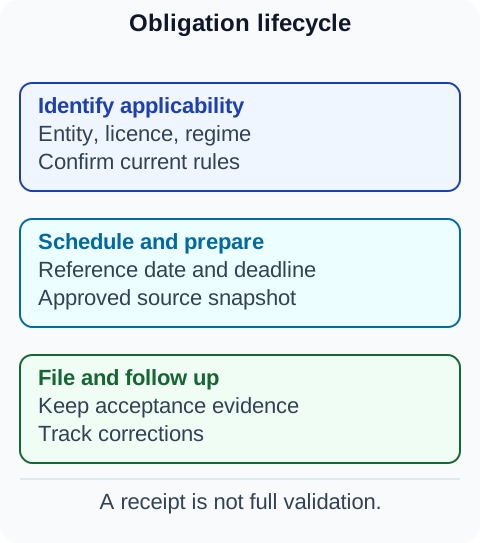
An illustrative internal calendar includes daily liquidity and limit monitoring, monthly statistics/flash work, quarterly close-linked returns, annual disclosures and resolution work, plus ad-hoc requests. These are examples of production cadence, not universal statutory frequencies: COREP, FINREP, Pillar3, large-exposure, liquidity and resolution obligations each follow their actual scope and instructions. Maintain owners/deputies, entity/reference date, remittance deadline, channel and dependencies; distinguish internal monitoring from a filing obligation.
4.3 Deep dive: cross-family reconciliation mechanics and revision-history scoring
Bridge differences by perimeter, valuation and measurement, classification, netting, currency, reporting date and aggregation. For example, accounting loans versus prudential exposure include provisions, off-balance-sheet conversion and consolidation adjustments; accounting cash versus LCR HQLA additionally reflects securities, eligibility, encumbrance and haircuts. Preserve each bridge's owner, inputs, rule version, tolerance and investigation record. A bridge supports investigation but cannot guarantee the absence of supervisory queries.
Trend revisions by frequency, materiality, direction, timeliness and root cause. Repeated preventable errors warrant investigation; bidirectional corrections are not inherently harmless, and a large honest correction is not inherently misconduct. Record source, mapping and interpretation repairs and the authority’s correction process. Supervisory response depends on findings, applicable powers and actual decisions; no automatic monthly-progress→skilled-person→Pillar2 ladder is prescribed.
5. Product and customer impact
Reporting shapes products indirectly: data-intensive products (cross-border, structured, derivatives) carry reporting costs priced into margins; disclosure transparency lets investors compare product mixes; statistical classifications (green lending, SME definitions) create product labels with reporting obligations attached. Customer data (consents, classifications) feeds returns — privacy and reporting duties balanced by design. The product impact is increasingly front-loaded: new product approval processes now require reporting-impact assessment, including which returns the product will affect, what data attributes must be captured at origination, and what ongoing reporting obligations the product creates. Products that cannot be efficiently reported (e.g., complex structured products with bespoke terms that do not map cleanly to taxonomy data points) carry a reporting cost premium that must be reflected in pricing. The trend toward granular reporting (loan-level data, transaction-level disclosures) is shifting the reporting burden from aggregate-level estimation to contract-level data quality — a fundamentally different challenge that requires investment in data infrastructure rather than modelling capability.
6. Regulatory and supervisory view
Each return has its own legal basis and submission instructions. AnaCredit currently collects loans to corporations and other legal entities, mostly monthly; it is not an all-borrower global credit register. DORA incident and information-register obligations are separate from accounting and prudential returns. Sustainability disclosure scope and frequency must follow the applicable rules rather than a blanket claim that all ESG reporting is quarterly. ECB AnaCredit.
7. Systems and data view
Reporting factory: consumption marts (frozen snapshots per return — each return consumes a specific snapshot version, preventing post-hoc data manipulation), mapping/transformation layer (versioned per taxonomy release, with dual-version parallel-run capability), calculation engines (RWA, ratios, aggregations — each engine versioned and validated), taxonomy/XBRL generator (producing the filing instance in the required format), validation engine (rules + plausibility — blocking and warning rules classified per taxonomy), submission gateway with receipts (electronic submission with acknowledgement tracking), query/correction workflow (query log, root-cause analysis, correction with cross-family impact assessment), archive (returns + inputs + evidence, retention per applicable rule and approved schedule). Controls: snapshot discipline (no post-close data changes without documented approval), mapping versioning (only current-version mappings active, with rollback capability), four-eyes submission (maker + checker, with independent review of the filing before submission), receipt reconciliation (filing acknowledgement tracked and reconciled against submission log). The architecture must support both recurring and ad-hoc demands: recurring returns benefit from automation and version control; ad-hoc demands (stress tests, inspections) require flexible query tools and rapid data extraction capabilities.
8. End to end process
- Calendar triggers cycle (automated alerts to all stakeholders, dependency mapping activated).
- Freeze snapshots post-close (GL and sub-ledgers locked, snapshot version recorded, any post-freeze adjustments routed through exception process).
- Run mappings/calculations (versioned mappings applied, calculation engines executed, results validated against expected ranges).
- Validate (rules + plausibility — apply the authority’s currently active validation rules, investigate warnings and document any legally permitted exception/deactivated-rule treatment; an internal override cannot waive a binding requirement).
- Review and attest (responsible officers review the filing, attest to its accuracy, document any known limitations).
- Submit with receipt (filing transmitted, acknowledgement received and logged).
- Handle queries; correct/resubmit if needed (query log activated, root-cause analysis performed, cross-family impact assessed before any correction).
- Archive everything (inputs, mappings, outputs, evidence retained per schedule, retrievable for future examinations).
9. Controls and risks
| Risk | Control | Evidence |
|---|---|---|
| Late submission | Calendar with owners/deputies, escalation | Submission receipts |
| Unvalidated filing | Applicable active-rule gates and authorised exception/escalation process | Rule version, results and authority correspondence |
| Query spiral | Query log with root-cause fixing | Query analytics |
| Archive gaps | Retention-enforced archiving | Archive audits |
| Snapshot drift | Post-close freeze with exception logging | Freeze logs |
| Cross-family inconsistency | Standing bridges with tolerance thresholds | Bridge reconciliation reports |
| Revision bias | Revision-history analytics with Board reporting | Revision reports |
10. Practical examples
A — Correction cascade (fictional): one mapping error touches COREP, Pillar 3 and statistics — single fix, three resubmissions, one query each. Lesson: cross-family impact analysis before any correction. The bank's correction process now includes a mandatory "cross-family impact checklist" that identifies all returns affected by a mapping change, ensures consistent correction across all families, and documents the rationale for any differences in correction timing. B — Surge week (fictional): stress-test ad-hoc lands on quarter-end; pre-planned surge roster absorbs it — capacity planning is a control. The surge roster includes: trained reserves from non-reporting functions (pre-qualified through annual training), vendor support agreements (activated through defined escalation procedures), and overtime protocols (pre-approved by HR with clear limits and compensation). C — Data-quality enforcement (fictional): a bank's statistical returns showed persistent revisions (small, one-directional, late) over four quarters; the supervisor placed the bank on a data-quality enforcement track requiring monthly progress reports, a skilled-person review, and a remediation programme with defined milestones. Total cost: approximately 4m over 18 months, versus an estimated 0.5m to fix the root-cause mapping issue at the outset.
11. Diagrams
Figure 1. Reporting families.
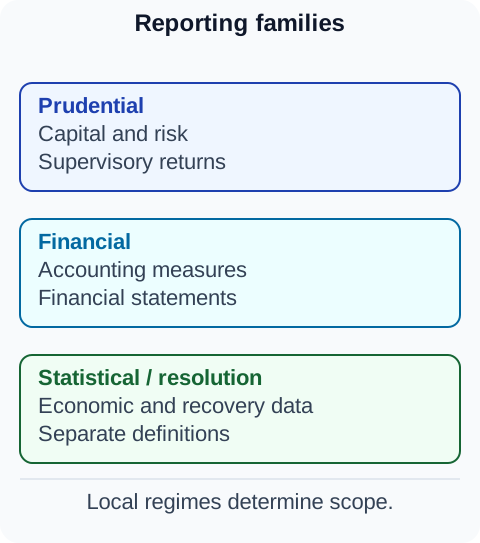 Figure 2. Source-to-report bridges.
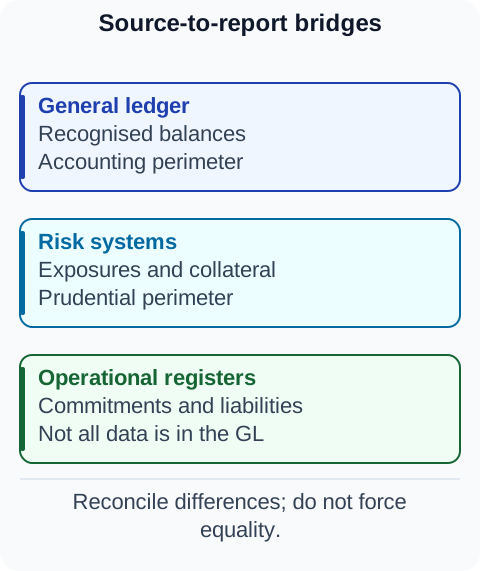 Figure 3. Obligation lifecycle.
12. Tables
Table 1 — Family map
| Family | Asks | Consumes |
|---|---|---|
| Prudential | Solvent? Liquid? | RWA, capital, LCR/NSFR |
| Financial | Financial information under the applicable basis | Reconciled IFRS or national-GAAP close and required attributes |
| Statistical | What happened economically? | Transactions, balances |
| Resolution | Failable safely? | Liabilities, functions |
| Disclosure | Believable publicly? | All of the above |
Table 2 — Submission hygiene
| Practice | Standard |
|---|---|
| Validation gate | Current authority rules, permitted exceptions and approval evidence |
| Four-eyes | Maker + checker + receipts |
| Query SLA | Acknowledge days, resolve weeks |
| Archive | Returns + inputs + evidence |
| Revision management | Root-cause lineage fix, not cell fix |
| Surge planning | Trained reserves, vendor support, overtime |
13. Illustrative banking case study
Repeated revisions (fictional). A sector-code translation table is stale. A reporting analyst fixes the cell each quarter but leaves the source mapping unchanged. The control owner assigns one mapping repair, reruns all affected reporting dates, assesses statistical and prudential impacts and follows the authority's correction process. Revision frequency is a useful internal indicator of unresolved causes; it is not a universal formula that mechanically produces a specified capital add-on.
14. BA, developer, tester and operations guidance
- BA: Inventory returns (basis, scope, frequency, owner) before any reporting requirement; map cross-family impacts; maintain a return register with current taxonomy versions, validation rules, and filing deadlines.
- Developer: Build snapshot discipline, versioned mappings, validation gates and receipt tracking into the factory; automate cross-family bridge reconciliation; implement query-response library with consistency checking.
- Tester: Resubmission paths (correct and re-file); cross-family consistency (same data point, different frameworks); calendar-boundary submissions (test cut-off handling); archive retrieval (verify retention and accessibility).
- Operations: Run the calendar visibly; staff surge rosters; log queries with root-cause fixes; maintain filing evidence packs; manage vendor relationships for taxonomy and engine updates.
15. Common mistakes
- Treating reporting as admin without SLAs or owners — it is a production business with consequences for failure.
- Improvising around validation or deadlines: follow the authority-specific active-rule, failed-validation, late-filing and escalation process rather than assuming a universal priority between error and lateness.
- Correcting one family while breaking others — cross-family impact analysis is mandatory.
- No surge capacity for ad-hoc demands — stress tests and inspections arrive without warning.
- Archives missing inputs (returns without evidence) — supervisors expect to see the full audit trail.
- Assuming reporting requirements never change; amendments may add, remove or simplify obligations.
- Under-investing in data infrastructure — manual processes cannot scale with growing requirements.
16. Key takeaways
- Five families, one lineage — differences bridged by controls, not assumed equal.
- Calendar with owners, deputies and escalation runs production — proactively, not reactively.
- Validation gates and four-eyes submission are non-negotiable — a failed validation is a failed filing.
- Corrections need cross-family impact analysis — one fix, all families checked.
- Revision history is supervised — fix lineage, not just cells; root-cause every revision.
- Reporting workload can rise or fall as requirements and automation change; invest against the bank’s measured obligations, controls and capacity.
- Surge capacity is planned, not improvised — trained reserves, vendor support, overtime protocols.
17. References and verification notes
- ECB AnaCredit: current scope and binding regulation versus non-binding manual.
- ECB SREP methodology: supervisory evaluation of governance and risk; no fixed penalty follows an individual reporting correction.
- All structures and examples are illustrative training designs.
- Basel Committee principles for effective risk data aggregation and reporting (BCBS d 239, March 2013).
- Staffing, costs, internal SLAs and cases in this chapter are illustrative operating choices, not industry statistics or statutory deadlines.