Chapter 002: Reading a Bank’s Balance Sheet
Section 1: How a Bank Works Financially · Chapter 002 of 100
An equity analyst opens two annual reports. Both banks report 1 billion in profit. Bank A funds itself with sticky retail deposits and lends conservatively; Bank B funds itself overnight in wholesale markets and holds complex trading assets. Same profit, completely different risk. The balance sheet — not the profit line — reveals the difference. This chapter teaches you to read a bank balance sheet and income statement the way finance professionals, supervisors and investors do.
1. Chapter opening
The Bank’s Business Model gave you the map: banks live on spread plus fees minus costs and losses. This chapter zooms into the two core financial statements. You will learn the standard anatomy of a bank balance sheet, how each line generates (or consumes) income, how the income statement is structured, and the key ratios professionals compute first. Later chapters build on every line introduced here: deposits (chapters 16–20), loans (21–25), treasury positions (31–35), impairment (41–45), capital (71–75) and disclosures (91–95).
2. Learning objectives
By the end of this chapter you will be able to:
- List the main asset and liability lines of a bank balance sheet and explain each in one sentence.
- Explain why deposits are liabilities and loans are assets, without hesitation.
- Walk through a bank income statement from net interest income to net profit.
- Calculate and interpret NIM, cost-to-income, ROA and ROE on simplified numbers.
- Connect any income line back to the balance sheet position that produced it.
- Spot funding fragility (wholesale dependence, maturity mismatch) from the liability mix.
3. Business context
The balance sheet is the bank's risk photograph at a point in time; the income statement is the film of one period. Business choices show up immediately: chasing loan growth expands assets (and future impairment risk); paying up for deposits protects liquidity but compresses margin; growing trading books adds volatile income. Supervisors read the same statements for safety — asset quality, funding stability, leverage — while investors read them for sustainable return. Finance must serve both readings from one controlled ledger.
| Reader | First question | Where they look |
|---|---|---|
| Treasurer | Can we survive a funding shock? | Deposit mix, wholesale maturities, liquid assets |
| Credit risk | Will the loan book hurt us? | Loan growth, arrears, coverage ratio, concentrations |
| Supervisor | Is capital adequate for these risks? | Equity, RWAs, buffers (Section 15) |
| Investor | Is the return sustainable? | NIM trend, cost-to-income, impairment charge, ROE |
| Auditor | Do the lines tie to the ledger? | Notes, reconciliations, substantiation (Section 11) |
4. Finance and accounting view
4.1 Assets: what the bank owns or is owed
| Asset line | What it is | Income it produces | Measured how (IFRS, headline) |
|---|---|---|---|
| Cash and central bank balances | Notes, reserves at the central bank | Little or policy-rate interest | Amortised cost |
| Loans and advances to customers | Mortgages, personal, corporate lending | Interest (effective interest method) | Commonly amortised cost less ECL; only if business-model and SPPI tests pass |
| Loans to banks / reverse repos | Interbank placements and collateralised lending | Interest | Commonly amortised cost; classification tests still apply |
| Debt securities (banking book) | Government and corporate bonds held for liquidity/return | Coupons, gains on sale | Amortised cost, FVOCI or FVTPL by business model |
| Trading assets and derivatives | Positions held for short-term profit, derivative receivables | Trading gains/losses | FVTPL (fair value) |
| Equity investments | Strategic stakes, Visa-type holdings | Dividends, fair value moves | Usually FVTPL or FVOCI (no recycling for equities) |
| Intangibles, goodwill, deferred tax | Software, acquisition premiums, tax assets | None directly | Different standards: intangible amortisation/impairment, goodwill impairment, DTA recoverability under IAS 12; CET1 treatment differs by item |
| Other assets | Prepayments, acceptances, sundry receivables | Various | Various |
Two warnings professionals memorise: goodwill and some deferred tax assets are deducted from regulatory capital — they count in accounting equity but not in CET1 (Accounting Equity versus Regulatory Capital). And derivatives appear gross as assets and liabilities in accounting but are netted under strict conditions only (IAS 32) — footnotes matter.
4.2 Liabilities: what the bank owes
| Liability line | What it is | Cost it creates | Behavioural note |
|---|---|---|---|
| Customer deposits (current, savings, term) | Money customers can withdraw | Interest expense; operations cost | Stability and pricing vary by depositor, insurance coverage, concentration and contract |
| Interbank borrowing and repos | Funding from other banks / collateralised borrowing | Market-rate interest | Can vanish in stress — the Northern Rock lesson |
| Debt securities issued | Bonds, commercial paper sold to investors | Coupons, issuance costs | MREL/TLAC-eligible instruments sit here (MREL and TLAC) |
| Trading liabilities and derivative payables | Short positions, derivative obligations | Trading losses | Volatile; collateral (margin) moves daily |
| Provisions | Expected credit losses on commitments, legal, restructuring | Impairment / expense charges | IAS 37 provisions vs IFRS 9 allowances — different rules |
| Other liabilities | Tax payable, lease liabilities, sundry payables | Various | Lease liabilities (IFRS 16) surprise beginners |
| Subordinated debt | Junior debt, partly counts as Tier 2 capital | Higher coupons | Loss-absorbing in resolution |
4.3 Equity: the shock absorber
Equity = Assets − Liabilities. Components: ordinary share capital, share premium, retained earnings, other reserves (including FVOCI and cash-flow-hedge reserves), minus treasury shares, plus minority interests. Two facts dominate bank analysis: losses are magnified by leverage: with assets 100 and equity 8, an unmitigated loss of 5 reduces equity to 3, a 62.5% reduction; and not all accounting equity counts as regulatory capital — deductions and prudential filters convert one into the other (Accounting Equity versus Regulatory Capital).
4.4 The income statement, line by line
Illustrative bank income-statement ordering under IAS 1; this sequence is not a mandatory universal layout. IFRS 18 applies from annual periods beginning 1 January 2027 unless adopted early, subject to local endorsement:
- Interest income → 2. Interest expense → 3. Net interest income → 4. Fee and commission income → 5. Fee expense → 6. Net fee income → 7. Net trading income → 8. Other operating income → 9. Total operating income → 10. Staff and administrative expenses → 11. Depreciation → 12. Operating costs → 13. Impairment charges → 14. Operating profit → 15. Share of associates, exceptional items → 16. Profit before tax → 17. Tax → 18. Net profit, split between shareholders and minority interests.
Other comprehensive income (OCI) sits below: fair value moves on FVOCI assets, cash-flow-hedge effects, pension remeasurements — items that change equity without touching profit. Analysts who ignore OCI miss real volatility.
4.5 Worked example: reading both statements together (fictional)
Bank Example plc, year-end (currency millions):
| Balance sheet | Amount | Income statement | Amount |
|---|---|---|---|
| Loans to customers | 60,000 | Interest income | 3,900 |
| Liquid assets | 15,000 | Interest expense | −1,400 |
| Securities | 15,000 | Net interest income | 2,500 |
| Other assets | 10,000 | Net fee income | 1,100 |
| Total assets | 100,000 | Trading + other | 400 |
| Deposits | 70,000 | Total income | 4,000 |
| Wholesale funding | 16,000 | Operating costs | −2,200 |
| Other liabilities | 6,000 | Impairment | −500 |
| Equity | 8,000 | Profit before tax | 1,300 |
| Tax (25%) | −325 | ||
| Net profit | 975 |
Ratios: Assume average earning assets of 85,000, average total assets of 100,000 and average equity of 8,000 equal the illustrated year-end amounts. NIM = 2,500 / 85,000 ≈ 2.94%. Cost-to-income = 2,200/4,000 = 55%. ROA = 975/100,000 ≈ 0.98%. ROE = 975/8,000 ≈ 12.2%. Leverage = 100,000/8,000 = 12.5x. A supervisor's first follow-ups: wholesale funding is 16% of total assets, or 17.4% of the 92,000 liabilities — what maturities? Impairment 0.8% of loans — through-the-cycle or benign-year number? Equity 8% — what survives CET1 deductions?
5. Product and customer impact
Customers never see the balance sheet, but they feel its constraints. A bank heavy on wholesale funding offers eye-catching savings rates until markets tighten, then cuts them first. A bank with a stretched loan-to-deposit ratio (loans ÷ deposits; here 60,000/70,000 ≈ 86%; interpret alongside funding mix, liquidity buffers and asset maturities) slows mortgage approvals when deposits leave. Capital-constrained banks raise loan margins or exit segments — small-business borrowers feel "the bank stopped lending" when really the bank's CET1 ratio stopped it. When studying the deposit and loan lessons (chapters 16–25), return to this chapter's anatomy and ask of each product: which asset line grows, which liability funds it, which income line moves.
6. Regulatory and supervisory view
Supervisors re-cut the same statements through prudential lenses: FINREP and COREP support supervisory financial and prudential reporting under the applicable jurisdiction, as explained in The Regulatory Reporting Landscape and European Union Reporting. Large-exposure rules constrain concentration; the leverage ratio provides a separate exposure-based backstop, developed in Capital Ratios, Buffers and the Leverage Ratio. Published accounts and prudential returns share a ledger but differ in scope (accounting vs regulatory consolidation), measurement (filters, deductions) and timing. Reconciling the two is a standing control (From Source Data to Regulatory Return).
7. Systems and data view
Each statement line is an aggregation over the chart of accounts, fed by product subledgers through the accounting hub. Key mappings a BA must know: loan system balance → loans and advances; deposit system → customer accounts liability; treasury platform → securities/trading/derivatives lines; ECL engine → allowance contra-asset and impairment charge; HR/fixed-asset systems → staff costs, depreciation. Dimensions attached to every posting (product, branch, currency, segment) enable the segment reporting investors read. Close systems freeze periods so statements are point-in-time consistent — backdated postings after freeze need controlled adjustments, not silent edits.
8. End to end process
Producing the statements each quarter: (1) freeze subledgers and interfaces at cut-off; (2) run accruals, ECL, fair values, FX revaluation; (3) post manual journals with maker-checker; (4) reconcile every subledger to the GL and clear or age breaks; (5) consolidate entities, eliminate intercompany balances; (6) generate statements, notes and analytical review (variance vs prior period with explanations); (7) management attestation, audit committee review, external audit procedures; (8) publish, then feed FINREP/COREP from the same close. A missed step 4 is how "profit surprises" are born.
9. Controls and risks
| Risk | Control | Evidence |
|---|---|---|
| Misclassified lines (e.g., trading vs banking book) | Booking-model governance, product approval | Classification papers, committee minutes |
| Cut-off errors (income in wrong period) | Value-date controls, accrual engines, close calendar | Accrual listings, cut-off testing |
| Unreconciled subledger differences | Daily auto-matching, aged-break escalation | Reconciliation packs with owner sign-off |
| OCI volatility unexplained | Valuation control, hedge documentation | Price-verification reports, hedge files |
| Disclosure gaps | Disclosure checklist mapped to standards | Tied-out checklist per note |
10. Practical examples
Example A — NIM illusion. A bank reports NIM rising from 2.5% to 2.9%. Finance decomposes: asset yields rose 1.2% but funding costs rose 1.6%; assume the asset/funding mix bridge explains the reported improvement through shrinking low-yield liquid assets. The 1.2 and 1.6 percentage-point changes alone cannot reproduce NIM: earning-asset/funding bases and volumes differ, so reconcile the full amount and average-balance bridge. Lesson: never read a ratio without its balance-sheet drivers.
Example B — The missing elimination. Two group entities report a 50 intercompany loan as asset and liability. Consolidation forgets the elimination: group assets and liabilities both overstated by 50, ratios distorted. Testers: intercompany elimination is a mandatory consolidation test case (Chapter on group reporting).
11. Diagrams
Figure 1. A balanced bank balance sheet.
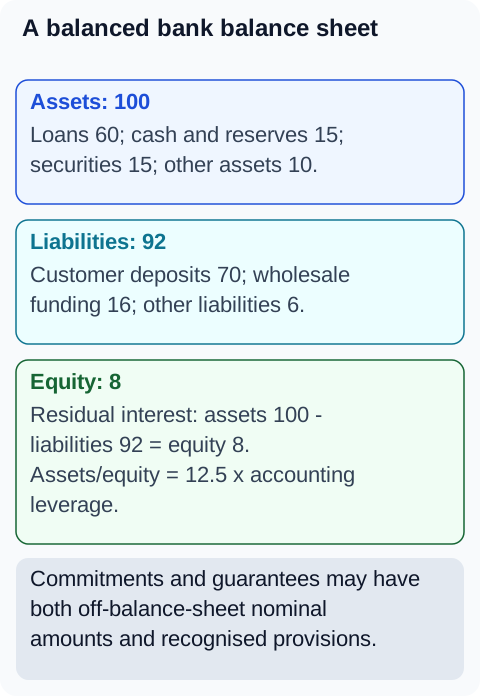
Figure 2. A simplified profit bridge.
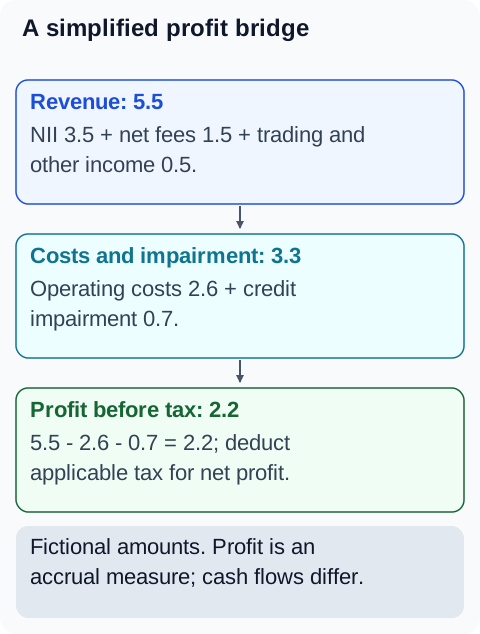
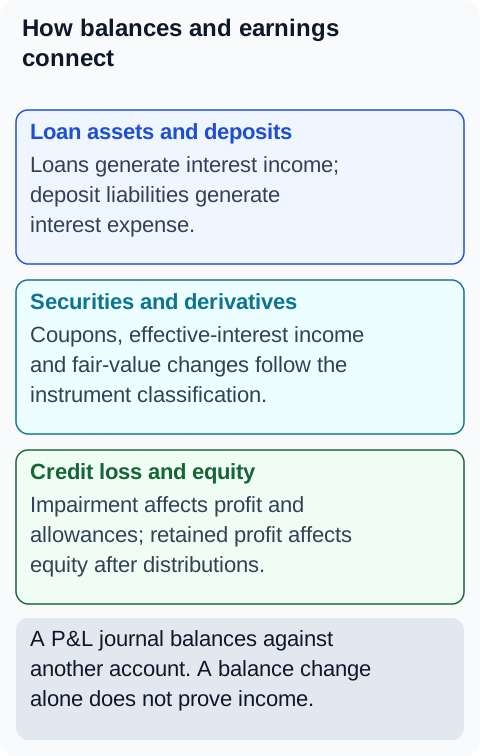
Figure 3. How balances and earnings connect.
12. Tables
Table 1 — Key ratios cheat sheet
| Ratio | Formula (simplified) | Interpret with |
|---|---|---|
| NIM | NII ÷ average earning assets | Rate, volume and mix drivers; consistent annualisation |
| Cost-to-income | Operating costs ÷ operating income | Definition, business model, one-off items and control investment |
| Cost of risk | Impairment charge ÷ average gross loans | Credit cycle, portfolio mix, recoveries and allowance coverage |
| ROA | Net profit ÷ average assets | Comparable periods and asset risk |
| ROE | Profit attributable to ordinary shareholders ÷ average ordinary equity | Cost of equity, leverage and capital strength |
| Loan-to-deposit | Defined loan measure ÷ defined deposit measure | Wholesale funding, maturity and concentration; no universal safe cutoff |
| CET1 ratio | Eligible CET1 ÷ RWAs | Applicable minima, buffers and bank-specific requirements |
Table 2 — Accounting vs regulatory view of the same equity
| Step | Effect (illustrative) |
|---|---|
| Accounting equity | 8,000 |
| Less: goodwill and intangibles | −600 |
| Less: certain deferred tax assets | −200 |
| Other prudential filters | −150 |
| CET1 capital (approx.) | ~7,050 |
13. Illustrative bank case study
A funding concentration becomes visible. In this fictional case, a mortgage bank funds much of its long-dated assets with short-term wholesale borrowing. Profit remains positive, but the maturity ladder shows large refinancing needs within a week. Treasury stress-tests loss of market access, distinguishes cash due from accounting income, and escalates the gap to ALCO. The exercise teaches learners to inspect funding concentration before drawing a safety conclusion from reported profit.
14. BA, developer, tester and operations guidance
- BA: When mapping a new product, document which balance-sheet and P&L lines it touches, its dimensions for segment reporting, and its funding/liquidity classification — not just the customer journey.
- Developer: Aggregation queries must run against frozen close snapshots, not live tables that move during the run; timestamp and version every extract.
- Tester: Recompute one full statement from subledger extracts independently and tie every line; test intercompany eliminations, FX translation and OCI recycling with seeded data.
- Operations: Daily flash P&L and balance-sheet movement reports catch booking errors within 24 hours; investigate any line moving without a business reason.
15. Common mistakes
- Calling deposits assets ("the bank's money") — they are obligations.
- Judging a bank on profit alone without funding mix, asset quality and leverage.
- Treating ROE as pure skill when leverage inflates it.
- Ignoring OCI — real value changes hide below the profit line.
- Confusing accounting consolidation scope with regulatory consolidation scope.
16. Key takeaways
- Assets (dominated by loans) must equal liabilities (dominated by deposits) plus thin equity.
- Every income line traces to a balance-sheet position; every position carries risk, funding cost or capital cost.
- NIM, cost-to-income, cost of risk, ROA/ROE and loan-to-deposit are the first-pass diagnostic kit.
- Accounting equity is the start, not the end, of the capital story.
- The liability mix predicts survival in stress better than the profit line does.
17. References and verification notes
-
IFRS Foundation: IFRS 18: mandatory for annual periods beginning on or after 1 January 2027, with early application permitted; local endorsement and bank-specific presentation require separate assessment.
-
IFRS Foundation: IFRS 9: classification depends on business model and contractual cash flows; initial recognition and directly attributable costs follow IFRS 9. This is the IFRS track, not US GAAP CECL.
-
Statement structure follows IAS 1 and IFRS 7 disclosure principles; IFRS 18 (effective for annual periods beginning on/after 1 January 2027, with comparatives) reshapes P&L categories — verify current endorsement status in your jurisdiction before implementation work.
-
Measurement headlines here are simplifications; full classification and measurement rules are in Section 8 (financial instruments), impairment in Section 9.
-
Ratio "healthy" ranges are indicative training guides, not supervisory thresholds; verify against the applicable rulebook and the bank's approved risk appetite.
-
The case is fictional; its funding and liquidity mechanisms are developed in the treasury and liquidity chapters.