Chapter 074: Capital Ratios, Buffers and the Leverage Ratio
Section 15: Regulatory Capital and Prudential Foundations · Chapter 074 of 100
This chapter explains capital ratios, buffers and the leverage ratio from the reporting bank's perspective. Examples are fictional; accounting follows IFRS unless another framework is expressly identified.
1. Chapter opening
Capital ratios compare eligible capital with the prescribed exposure measure. CET1, Tier 1 and total capital use RWA; the Basel leverage ratio uses Tier 1 and its leverage exposure measure. Headroom must cover every applicable layer, buffer and entity constraint, not only the highest-looking headline ratio.
2. Learning objectives
- Calculate each capital and leverage ratio.
- Identify headroom in amounts and feasible growth scenarios.
- Explain buffer conservation without applying restrictions above a full buffer.
- Include capital quality and bank-specific requirements.
3. Business context
A bank can have comfortable CET1 but little total-capital headroom if AT1/Tier 2 are limited. A low-RWA asset expansion can strain leverage before risk-based ratios. Compare the actual business action against all constraints, including liquidity and local supervisory requirements.
4. Finance and accounting view
4.1 Ratios
Assume CET1 7,050, eligible AT1 800 and Tier 2 900; Tier 1 is 7,850 and total capital 8,750. RWA is 58,000 and leverage exposure 140,000. Ratios are CET1 12.155%, Tier 1 13.534%, total capital 15.086% and leverage 5.607%.
4.2 Requirement and amount headroom
For this simplified illustration only, use Basel minimums 4.5% CET1, 6% Tier 1 and 8% total, plus a 4.5% combined buffer to be met with CET1, with no Pillar 2, leverage add-on, minimum TLAC capital usage or other requirement. Full-buffer thresholds are therefore 9.0%, 10.5% and 12.5%. A 3% leverage minimum is also assumed. These are not a particular bank's current legal stack.
| Constraint | Full threshold | Required amount | Capital held | Amount headroom |
|---|---|---|---|---|
| CET1 | 9.0% of RWA | 5,220 | 7,050 | 1,830 |
| Tier 1 | 10.5% of RWA | 6,090 | 7,850 | 1,760 |
| Total | 12.5% of RWA | 7,250 | 8,750 | 1,500 |
| Leverage | 3.0% of exposure | 4,200 | 7,850 | 3,650 |
Total capital is the tightest risk-based constraint in this example. Raw basis-point headrooms with different denominators cannot independently establish the binding constraint. With capital amounts unchanged, maximum extra RWA before these full-buffer thresholds is the minimum of 7,050/0.09 - 58,000 = 20,333.3; 7,850/0.105 - 58,000 = 16,761.9; and 8,750/0.125 - 58,000 = 12,000. Growth also changes leverage and funding, so this is not blanket permission to lend 12,000.
4.3 Conservation and capital quality
CET1 used to meet Tier 1 or total-capital minimums is unavailable to meet the buffer. With no Pillar 2 or CET1 needed for a minimum TLAC requirement, the effective minimum CET1 usage can be expressed as max(4.5%, 6% - AT1/RWA, 8% - (AT1 + Tier 2)/RWA); applicable local rules determine the exact distribution trigger and calculation.
Under the Basel conservation design, the first through fourth quartiles of buffer coverage imply minimum earnings retention of 100%, 80%, 60% and 40%, respectively: corresponding maximum distributions are 0%, 20%, 40% and 60%. Above the full buffer, this buffer-quartile restriction does not apply. The distributable earnings base, covered distributions and local MDA formula are not simply all cumulative profits since breach. Other legal/supervisory restrictions can still apply above buffers.
5. Product and customer impact
Growth and distribution choices can affect future lending capacity and resilience. Buffer compliance alone does not establish that a dividend is lawful, prudent or supported by cash. Assess reserves, forecasts, liquidity and any required approvals.
6. Regulatory and supervisory view
Basel risk-based requirements, leverage and the capital conservation standard provide international reference points. Local regimes can add systemic, Pillar 2 and leverage requirements and distinct distribution calculations. CCyB is bank-specific according to relevant exposures/rules; a country's headline setting is not automatically every bank's complete buffer.
7. Systems and data view
Maintain capital tiers, RWA, leverage exposure and all requirement layers with effective dates and entity scope. Reconcile denominator adjustments for derivatives, securities financing and off-balance-sheet items. Model action-specific impacts rather than subtract a generic capital percentage from book assets.
8. End to end process
- Reconcile eligible capital by tier.
- Validate total RWA and leverage exposure.
- Assemble current applicable thresholds and buffers.
- Calculate all ratios and amount headrooms.
- Test the proposed growth/distribution action against every constraint.
- Review adverse scenarios and obtain required approvals.
9. Controls and risks
| Ratio risk | Control |
|---|---|
| Total-capital shortfall hidden by CET1 | Complete capital-quality stack |
| Book assets used for leverage | Regulatory exposure reconciliation |
| Restriction applied above full buffer | Correct coverage and local formula |
| Country CCyB directly copied | Exposure-weighted applicable requirement |
| Growth judged from one ratio | Action-specific multi-constraint test |
10. Practical examples
A loan expansion of 10,000 with incremental RWA 3,500 and equal leverage exposure, with capital unchanged, gives CET1 7,050/61,500 = 11.463% and leverage 7,850/150,000 = 5.233%. The CET1 drop is about 0.692 percentage point; leverage drops about 0.374. A zero-credit-RWA asset expansion of 10,000 leaves the RWA ratios unchanged but has the same leverage effect, assuming no other exposures, income or adjustments. A cash dividend reduces equity/eligible capital as applicable and cash; do not assume it improves leverage merely because assets fall.
11. Diagrams
Figure 1. Capital and leverage ratios.
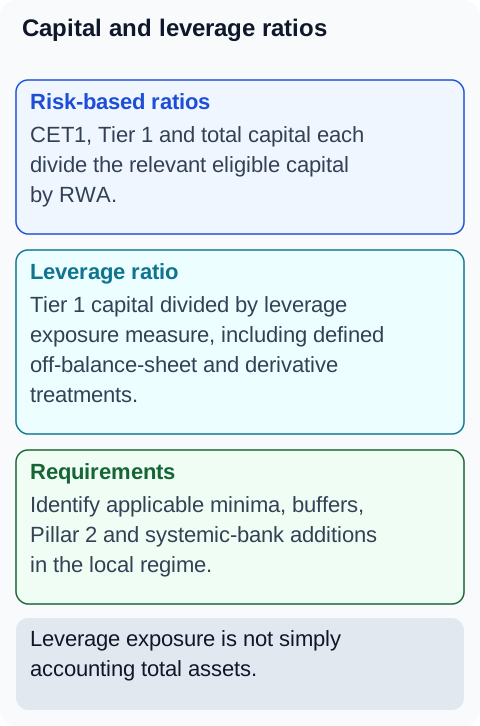 Figure 2. Buffers and distribution restrictions.
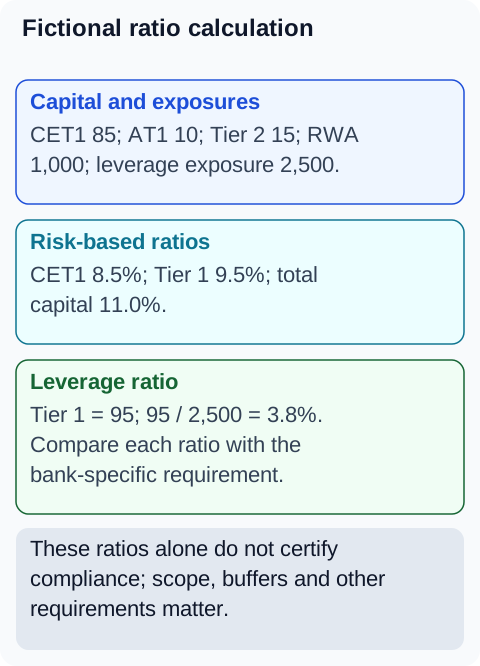
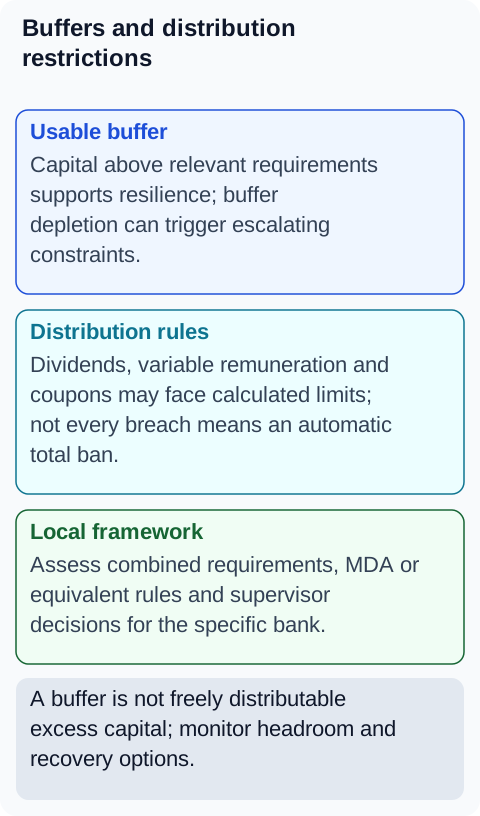 Figure 3. Fictional ratio calculation.
12. Tables
| Buffer coverage, assuming all minima met | Minimum retention | Maximum covered distributions |
|---|---|---|
| First quartile | 100% | 0% |
| Second | 80% | 20% |
| Third | 60% | 40% |
| Fourth | 40% | 60% |
| Above full buffer | 0% under this mechanism | No quartile cap under this mechanism |
Exact boundaries and applicable distribution amounts follow the governing standard and local implementation.
13. Fictional banking case study
A fictional bank approved growth using CET1 headroom alone. Its total-capital threshold allowed only 12,000 additional RWA, below the CET1-based 20,333. Review required the plan to meet total-capital and leverage constraints as well. Management assessed instrument issuance and balance-sheet changes separately instead of assuming more CET1 ratio headroom solved every limit.
14. BA, developer, tester and operations guidance
The equity-to-capital bridge supplies numerators; RWA methods supply one denominator. Capital planning models the full stack over time. Liquidity and resolution requirements remain separate constraints.
15. Common mistakes
- Ignoring Tier 1/total minima when testing buffer coverage.
- Using accounting equity/assets as Basel leverage.
- Applying a 40% distribution cap above a full buffer.
- Inferring binding constraints from raw percentage-point headroom alone.
- Treating RWA relief as a capital issuance.
16. Key takeaways
Reconcile every numerator and denominator, apply the complete stack and compare feasible actions in amounts. Buffer mechanics and capital quality are as important as the headline CET1 ratio.
17. References and verification notes
- Basel risk-based requirements and leverage standard.
- Basel III capital/conservation standard: underlying principles, consolidated subsequently.
- Figures and requirements are explicitly simplified fictional assumptions; current domestic requirements and bank decisions must be assessed separately.