Chapter 011: The Bank’s Finance Technology Landscape
Section 3: Finance Systems and Accounting Architecture · Chapter 011 of 100
A fictional landscape has twenty product processors, three GLs, five risk engines, two warehouses and many spreadsheets. Real inventories vary; acquisition and past design decisions can create complex dependencies. Transformation starts with an honest map: what exists, what feeds what, what's golden, what's legacy, what dies. This chapter maps source systems, warehouses, marts and the interfaces between them.
1. Chapter opening
Landscape layers: channels/origination (events), product processors/subledgers (contracts), treasury/risk engines (valuations, ECL, RWA), accounting hub/GL (postings), finance warehouse (history, snapshots), reporting marts (FINREP/COREP/Pillar 3/liquidity slices), GRC/workflow (attestations, findings), and the spreadsheet shadow (inventory, migrate, retire). Interfaces (batch/file/API/streaming) with contracts (format, frequency, completeness proofs). This chapter inventories, maps and rationalises.
The finance technology landscape is the infrastructure on which every reporting obligation depends. When a bank cannot produce a timely COREP submission, the problem is rarely the regulatory template itself; it is almost always a landscape issue: a feed that arrived late, a system that computed the wrong number, a mart that was not refreshed, or a spreadsheet that was not updated. Understanding the landscape — its layers, its interfaces, its failure modes — is therefore not an IT concern; it is a finance concern. The CFO who cannot explain where the numbers come from is the CFO who cannot defend them under examination.
2. Learning objectives
- Inventory landscape layers with system roles and owners.
- Map interfaces (source to consumer) with contracts and SLAs.
- Design warehouse (history) vs mart (purpose-slice) separation.
- Run spreadsheet discovery, risk-rating and migration.
- Plan landscape rationalisation (retire, consolidate, re-platform) with sequencing.
3. Business context
Landscape complexity taxes every change (interface regression), every close (feed orchestration), every examination (lineage explanation). Rationalisation pays in close speed, control quality and change cost — funded as multi-year programmes with benefits tracked like Delivering Accounting and Reporting Change. Vendor vs build decisions (core banking, GL, engines) lock in decades — decided with exit strategies modelled upfront.
The cost of landscape complexity is not just operational; it is strategic. A bank that takes 15 days to close its books cannot produce management accounts quickly enough to inform tactical decisions; a bank that cannot trace a regulatory figure to its source cannot respond to supervisory queries with confidence; a bank that relies on spreadsheets for material reporting cannot hire a new analyst without a multi-month knowledge transfer. Each of these constraints reduces the bank's competitive agility, and each is a landscape problem with a landscape solution. The business case for rationalisation is not abstract: it is measured in close-days reduced, error-rates fallen, examination findings avoided, and change-costs saved. Evaluate payback using evidenced implementation cost and measured control/operating benefits; there is no universal payback period.
| Layer | Role | Failure mode |
|---|---|---|
| Processors | Contract truth | Stale product logic |
| Engines | Computed truth (ECL/RWA/valuation) | Unvalidated models |
| GL | Reported truth | Period-control gaps |
| Warehouse/marts | History/slices | Snapshot indiscipline |
| Spreadsheets | Shadow truth | Key-person + error risk |
4. Finance and accounting view
4.1 Interface contracts (fictional loan feed)
Daily 02:00 file/API: full facility snapshot + delta events; source completeness proof (expected populations, counts and control totals reconciled to the producer); hashes separately prove file integrity; schema versioned (v7 current, v6 deprecated with sunset date); SLA (delivered by 03:00, late-escalation to producer owner); consumer: ECL engine + warehouse + GL tie-out. Breaks route to exception queues with reason codes (Reliable Accounting Interfaces).
The interface contract defines what data moves, when it moves, in what format, and what happens when it does not arrive on time or in the expected shape. It records the producer and consumer owners, schema and field definitions, delivery frequency, SLA and escalation path. Its source completeness method reconciles the expected producer population, record counts and control totals to what the consumer received. Hash comparisons separately test whether the agreed file changed during transfer; a matching hash cannot establish that the producer included every required record. Documented ownership and evidence reduce dependence on individuals and make exceptions reviewable.
4.2 Warehouse vs marts
A warehouse or other governed historical store preserves approved source versions, adjustments and snapshots. Reporting marts provide purpose-specific views for financial, risk, liquidity and management reporting. Both full rebuilds and controlled incremental refreshes can work: record input versions, validate completeness and retain a reproducible output.
A mart may depend on another governed data product where ownership, lineage and change impact are explicit. Avoid undocumented chains and circular dependencies rather than imposing a universal topology. Shared input data does not eliminate differences in consolidation perimeter, valuation, date or classification; reconcile those differences.
4.3 Deep dive: spreadsheet migration waves and interface ownership registries
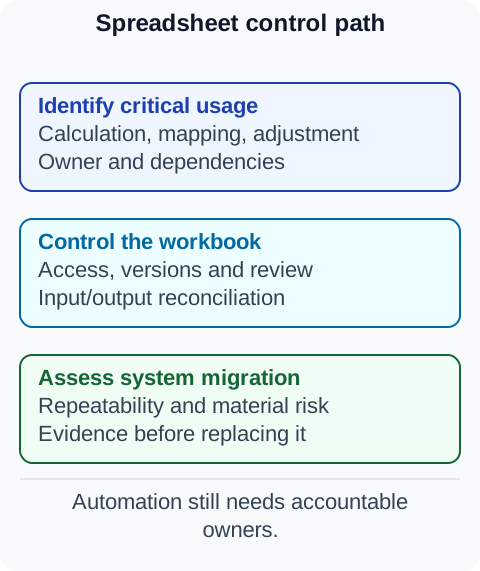
Risk-rate end-user computing (EUC) by materiality, complexity, access, change control, validation, recoverability and key-person dependence. A well-controlled spreadsheet can be appropriate; an undocumented material calculation needs stronger controls or migration. Before retiring one, document its inputs, formulas, adjustments and consumers, compare old and new output on agreed populations, explain intentional differences and archive required evidence.
Maintain a feed registry containing producer/consumer owners and deputies, schema version, cutoffs, proof method, escalation and recovery instructions. Compare the registry with actual scheduled jobs and consumers to discover orphan feeds. An unregistered critical feed must be contained and assigned an owner through a controlled continuity plan; abruptly quarantining it may itself break reporting.
5. Product and customer impact
Landscape quality surfaces as product agility (new launches need feeds/marts/engines ready — platform readiness gates launches), data-driven personalisation (golden customer data), and resilience (outage recovery depends on interface decoupling and replay). Legacy drag slows all three — rationalisation is product strategy, not IT housekeeping. A bank that cannot launch a new product because the landscape cannot support the new data requirements is a bank that is losing market share to more agile competitors. A bank that cannot personalise customer offers because its customer data is fragmented across multiple systems is a bank that is competing on price rather than relationship. A bank that cannot recover from a system outage because its interfaces are tightly coupled is a bank that is one failure away from a customer-facing incident. Landscape investment is product investment.
6. Regulatory and supervisory view
Supervisors examine landscape documentation (architecture maps, interface registers), spreadsheet controls (EUC policies with inventories and testing), change governance (release management for finance systems), and resilience (recovery objectives for reporting-critical systems). Outsourcing/cloud rules add third-party and concentration-risk duties (exit plans, audit rights — verify locally). Supervisors expect that the bank's landscape is documented, controlled, and resilient: they will ask for architecture maps during examinations, they will test spreadsheet controls during IT audits, and they will review change governance during process reviews. A bank that cannot produce its architecture maps is a bank that cannot explain its lineage, which is a finding.
7. Systems and data view
Reference architecture: event bus (immutable, replayable) to processors to hub/GL to warehouse (snapshots) to marts (versioned slices) to returns/disclosures, with MDM, lineage catalogue, DQ engine and GRC overlaying. Interface patterns: batch files (reconciled), APIs (contract-tested), streaming (delivery guarantees plus idempotent business effects and end-to-end reconciliation). Environment discipline (dev/test/prod parity for finance systems, masked data below prod). The reference architecture is the target state; most banks are somewhere between the current state (fragmented, undocumented, spreadsheet-dependent) and the target. The gap analysis — what exists versus what is needed — drives the rationalisation roadmap.
8. End to end process
- Inventory systems/interfaces/spreadsheets. 2. Map with owners/SLAs. 3. Designate golden sources. 4. Separate warehouse/marts properly. 5. Migrate spreadsheets by risk. 6. Rationalise (retire/consolidate) in sequenced waves. 7. Govern changes with regression discipline. The process is not linear; it is iterative. Each wave of rationalisation produces a cleaner landscape, which makes the next wave easier. The key is to start: the first wave is always the hardest (political resistance, technical complexity, benefit uncertainty), but it establishes the pattern that subsequent waves follow.
9. Controls and risks
| Risk | Control | Evidence |
|---|---|---|
| Undocumented interfaces | Interface register with contracts | Register audits |
| Undocumented or circular mart dependencies | Governed source contracts and dependency review | Design reviews and reconciliations |
| Shadow spreadsheets | EUC inventory + migration plans | Inventory trend |
| Change breakage | Regression + parallel runs | Release test packs |
| Orphan feeds | Completeness sweeps | Sweep reports |
| Environment leakage | Dev/test/prod isolation | Access logs |
10. Practical examples
A — Feed orphans: critical ECL feed owned by a departed contractor's team; failure discovered at close. Fix: ownership registry with deputy coverage enforced quarterly. The feed had been operating for three years without a documented owner; when the contractor left, nobody knew the feed existed until it failed during a close cycle. The failure was not catastrophic (the close was delayed by one day while the feed was reconstructed), but the investigation revealed that the feed had been producing subtly incorrect data for two months — an error that required a restatement. The ownership registry prevents recurrence: every feed is documented, every owner has a deputy, and the deputy-readiness test ensures that the deputy can actually operate the feed.
B — Spreadsheet retirement: top-20 EUC migrated in 18 months; close shortened 3 days; key-person risk halved — benefits certified like Delivering Accounting and Reporting Change.
10.3 Worked example: orphan-feed census (fictional)
Register-completeness sweep: production inputs inventoried (847 feeds) vs register entries (812) = 35 orphans. Triage: 12 critical (ECL inputs, rate feeds, staging flags — contracted and owned within 2 weeks), 15 medium (contracted within quarter), 8 decommissioned-but-still-flowing (switched off after impact analysis — 2 resurrect dormant downstream jobs, caught in testing). Oldest orphan: 6 years unowned, feeding a tolerated-but-unvalidated adjustment. Ownership attestation cycle established (annual, with deputy-readiness tests); register completeness re-swept semi-annually with trend reporting (orphan count to zero, then stays zero). Cost: 4 weeks' analyst time. Value: the next feed failure pages an owner in minutes instead of discovering orphanhood mid-close — documented ownership can shorten incident triage; measure actual response times rather than assume every future failure will be resolved faster.
11. Diagrams
Figure 1. Finance technology layers.
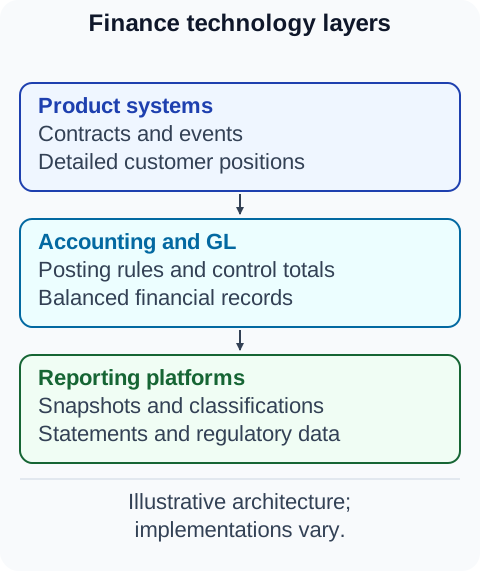 Figure 2. System responsibilities.
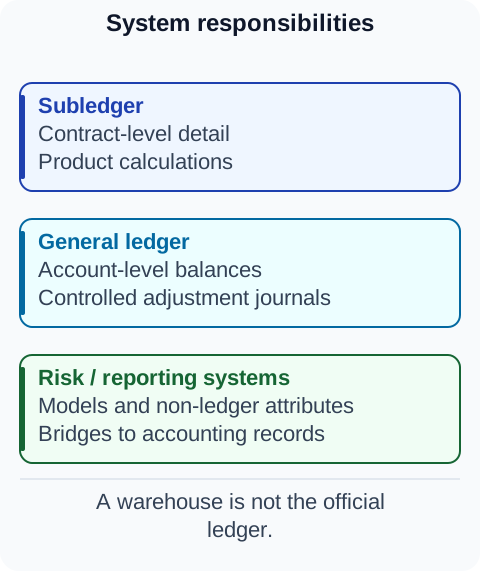 Figure 3. Spreadsheet control path.
12. Tables
Table 1 — Interface register extract (illustrative)
| Feed | Contract | SLA | Owner |
|---|---|---|---|
| Loans to ECL | Snapshot + delta, v7 | 03:00 daily | Lending ops |
| GL to warehouse | Journal extract | Post-close +2h | Financial control |
| Risk to marts | Staging/parameters | Pre-reporting D-2 | Credit risk |
Table 2 — Rationalisation waves (illustrative)
| Wave | Action | Benefit |
|---|---|---|
| 1 | Retire duplicate GL | Single reported truth |
| 2 | Migrate top-20 EUC | Close minus 3 days |
| 3 | Consolidate marts | No chain divergence |
13. Illustrative bank case study
Five ledgers, one group close. In this fictional case, an acquired group retains five GLs. It defines consistent group policies and mappings, performs intercompany eliminations and records source-ledger identity on every balance. It then assesses consolidation against the risk and cost of replacing the ledgers. A single GL can reduce complexity, but multiple governed ledgers are not inherently inaccurate; the failure is unproved mapping, lineage or reconciliation.
14. BA, developer, tester and operations guidance
- BA: Inventory and map before any finance requirement; specify interface contracts explicitly.
- Developer: Build to contracts with versioning; replay support; masked lower environments.
- Tester: Contract tests per interface; regression on change; spreadsheet-parallel proof.
- Operations: Own interface SLAs; monitor feed health like payment queues.
15. Common mistakes
- Undocumented mart dependencies, circular chains or lost lineage; governed mart sourcing is not inherently prohibited.
- Undocumented interfaces ("tribal feeds").
- Uncontrolled material spreadsheets without ownership, change controls or reconciliation; appropriate governed EUC can remain valid.
- Changes without regression on finance systems.
- Rationalisation perpetually deferred ("after this close").
- Assuming the first architecture diagram is the last one needed.
- Migrating spreadsheets without parallel-run proof.
16. Key takeaways
- Map truth layers (processors to engines to GL to warehouse to marts) with owners.
- Contracts (format/SLA/proofs) govern every interface.
- Marts use governed, reproducible source contracts, including a controlled upstream mart where appropriate.
- Retire spreadsheets by risk with parallel proof.
- Rationalise in funded waves with certified benefits.
- Orphan feeds are discovered by completeness sweeps, not by waiting for failures.
- Landscape investment is product investment, not IT housekeeping.
17. References and verification notes
- BCBS 239: risk data aggregation principles: governance, architecture, accuracy, completeness, timeliness and adaptability underpin risk-data aggregation; scope and supervisory application vary. It prescribes neither one warehouse architecture nor universal numeric reconciliation tolerances.
- Outsourcing/cloud concentration and EUC supervisory expectations vary by jurisdiction — verify locally; resilience objectives per operational-resilience frameworks.
- Architectures are illustrative training designs.