Chapter 075: Capital Adequacy and Planning
Section 15: Regulatory Capital and Prudential Foundations · Chapter 075 of 100
This chapter explains capital adequacy and planning from the reporting bank's perspective. Examples are fictional; accounting follows IFRS unless another framework is expressly identified.
1. Chapter opening
Capital planning projects eligible resources, RWA, leverage exposure and requirements under base and adverse scenarios. It tests whether the bank can execute its strategy while retaining adequate resilience. Forecast actions are not capital held today; show their timing, costs, eligibility and execution uncertainty.
2. Learning objectives
- Build an amount-based multi-year CET1 and ratio bridge.
- Separate CET1 issuance, AT1 issuance and RWA actions.
- Distinguish requirements, guidance and internal targets.
- Challenge distributions and recovery actions under stress.
3. Business context
Growth can consume capital through RWA without reducing the CET1 amount. Earnings replenish capital only to the extent eligible after distributions and other adjustments. A requirement increase consumes headroom but is not an accounting loss. Plans must cover entity restrictions and capital quality as well as consolidated ratios.
4. Finance and accounting view
4.1 Amount-based plan
The fictional bank opens with CET1 9.76 billion and RWA 80 billion: ratio 12.2%. In year 1, eligible profit is 0.90 and dividends 0.18, with no other capital movements. CET1 closes at 10.48; RWA is 88; ratio is 11.909%. In year 2, profit 0.80 and dividends 0.16 raise CET1 to 11.12; RWA of 88.35 gives 12.586%. In year 3, a loss of 0.80 and no distributions reduce CET1 to 10.32. RWA grows 2% to 90.117; ratio is 11.452%.
For illustration, the full applicable CET1 threshold is assumed to rise from 9.0% in year 1 to 9.5% in years 2/3. It reduces headroom but is not subtracted again from CET1 or its ratio. These simplified thresholds do not model a real supervisory stack.
4.2 Actions and stress
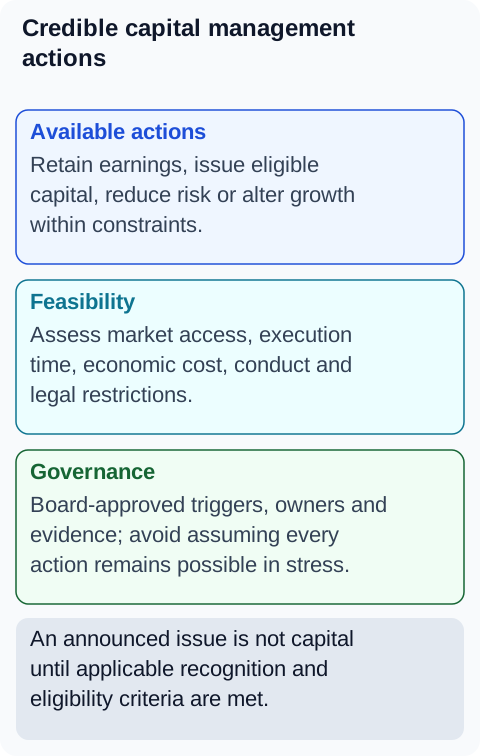
An eligible AT1 issue of 0.60 increases AT1/Tier 1 but leaves year-3 CET1 10.32 and its ratio 11.452% unchanged, assuming no costs or other effects. A common-equity issue of 0.60 instead raises CET1 to 10.92; with RWA 90.117 the ratio is 12.118%. A genuine RWA reduction of 2.00, assuming no accounting loss, gives 10.32/88.117 = 11.712%. These are distinct actions; actual issuance costs, approval, market capacity and sale gains/losses must be incorporated.
An asset sold below carrying value creates a loss that can reduce capital and tax; RWA relief is not free. Avoid counting an asset sale, securitisation and hedge as three reductions of the same exposure. Future uncommitted actions should not be booked into today's accounts merely because they support a stress plan.
4.3 Governance and requirements
Separate legally binding requirements, buffers, supervisory guidance and internal risk-appetite targets. For ECB-supervised banks, P2R is binding while P2G is not legally binding; P2G shortfall is not automatically an MDA trigger. P2R quality requirements and any supervisory decision must be reflected. The ECB notes a minimum CET1 portion of 56.25% of P2R under the relevant CRD provision, with higher portions possible; it is not a worldwide rule for all Pillar 2 regimes.
Stress plans should model earnings, credit deterioration, OCI, deductions, capital eligibility, RWA and leverage exposures coherently. Management actions need realistic timing, customer/market effects and legal/operational dependencies. A universal fixed forecast-error capital add-on or four-quarter supervisory decision timetable is not assumed.
5. Product and customer impact
Distributions require more than forecast ratio headroom: assess legal distributable reserves, cash, current/future requirements, resilience and required approvals. Scrip dividends, buybacks and capital calls each have specific effects; none is automatically capital-neutral. Growth controls should consider customer commitments and orderly service delivery.
6. Regulatory and supervisory view
ECB P2R and P2G illustrate the legal distinction in that regime. Basel capital principles are implemented locally. Buffer restrictions use the applicable distribution/earnings formula, not an assumed tally of all profit since breach. Capital actions require instrument and supervisory eligibility, including any issue, redemption or distribution approvals.
7. Systems and data view
Link the planning model to opening capital, RWA and exposure returns. Store scenario assumptions, entity scope, requirements, action IDs, approval status and effect dates. Preserve the pre-action forecast and an action bridge so the benefit is not silently counted in both earnings and capital rows.
8. End to end process
- Reconcile opening regulatory resources and exposures.
- Assemble effective-dated requirements, guidance and targets.
- Forecast earnings, distributions and deductions in amounts.
- Project RWA and leverage under base/adverse scenarios.
- Challenge feasible actions and capital quality.
- Approve, monitor and refresh the versioned plan.
9. Controls and risks
| Plan risk | Control |
|---|---|
| AT1 booked as CET1 | Tier-specific action bridge |
| Buffer increase deducted from capital | Requirement versus numerator separation |
| Sale relief ignores accounting loss | Full proceeds/carrying-value/tax model |
| Same exposure relieved twice | Action linkage and exclusivity |
| Optimistic issuance assumed certain | Execution timing/cost and failure scenario |
10. Practical examples
| Year | Opening CET1 | Profit/(loss) | Dividends | Closing CET1 | RWA | Ratio | Assumed threshold | Headroom pp |
|---|---|---|---|---|---|---|---|---|
| 1 | 9.760 | 0.900 | 0.180 | 10.480 | 88.000 | 11.909% | 9.0% | 2.909 |
| 2 | 10.480 | 0.800 | 0.160 | 11.120 | 88.350 | 12.586% | 9.5% | 3.086 |
| 3 | 11.120 | -0.800 | 0.000 | 10.320 | 90.117 | 11.452% | 9.5% | 1.952 |
Amounts are billions. The table omits other equity/deduction movements and capital tiers by assumption; a live plan must include them and test all constraints.
11. Diagrams
Figure 1. Capital adequacy planning.
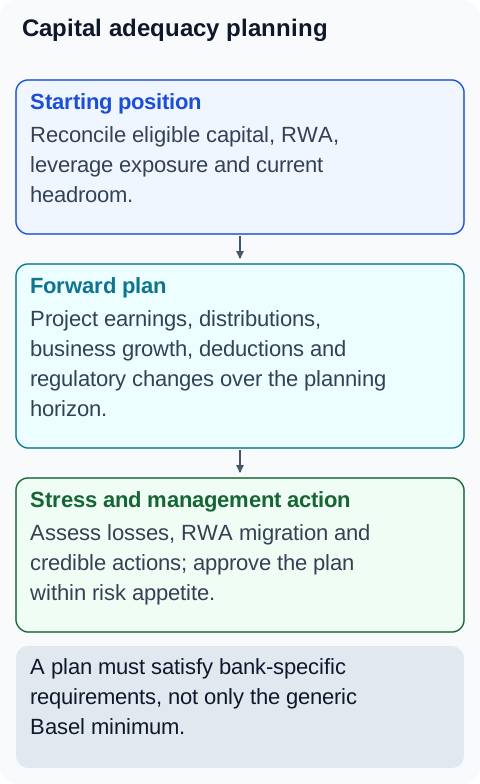 Figure 2. Profit, RWA and capital headroom.
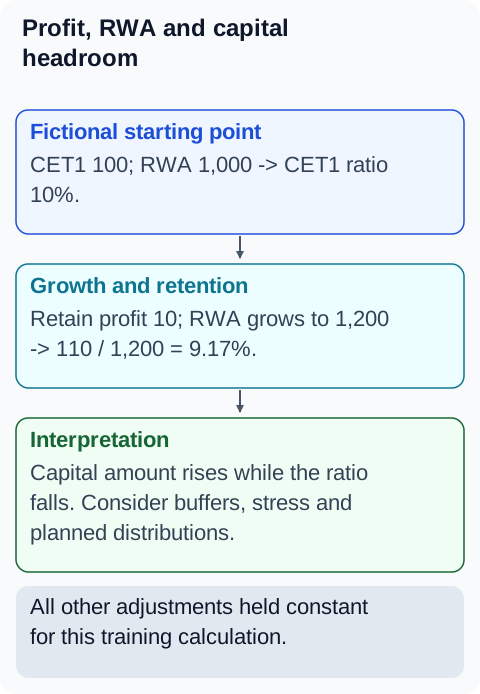 Figure 3. Credible capital management actions.
12. Tables
| Year-3 alternative, each from base | CET1 | RWA | CET1 ratio |
|---|---|---|---|
| Base | 10.32 | 90.117 | 11.452% |
| AT1 issue 0.60, no other effects | 10.32 | 90.117 | 11.452% |
| Common-equity issue 0.60, no costs | 10.92 | 90.117 | 12.118% |
| RWA reduction 2.00, no loss/cost | 10.32 | 88.117 | 11.712% |
13. Fictional banking case study
A fictional bank promised an AT1 issue would restore CET1 headroom after stress. Review showed the plan's CET1 requirement remained unchanged by the issue. The Board reconsidered common-equity options, retained earnings and supported exposure actions, testing market capacity and customer effects before approving the revised plan.
14. BA, developer, tester and operations guidance
Budgeting supplies earnings scenarios; stress testing challenges losses and exposures. Capital definitions determine eligibility. Ratio/buffer analysis tests each year against the complete applicable stack, while liquidity planning assesses funding separately.
15. Common mistakes
- Subtracting a CCyB increase from reported CET1.
- Treating AT1 as common equity.
- Ignoring sale losses and issuance costs.
- Counting unexecuted future actions as today's capital.
- Treating P2G as automatically legally binding or an MDA trigger.
16. Key takeaways
Plan capital in amounts before calculating ratios and headroom. Identify the right capital tier for each action and retain a credible no-action/adverse case. Requirements and guidance must follow the actual jurisdiction and supervisory decision.
17. References and verification notes
- ECB Pillar 2 requirement and Pillar 2 guidance: regime-specific distinctions and composition.
- Basel risk-based requirements: international reference, implemented through domestic rules.
- All forecasts, thresholds and management actions are fictional, simplified examples.