Chapter 076: Liquidity Risk and the Funding Profile
Section 16: Liquidity, Funding and Interest Rate Risk · Chapter 076 of 100
Ratios pass, buffers exist, scenarios run — but who owns liquidity strategy, and would the supervisor agree it's adequate? The Internal Liquidity Adequacy Assessment Process (ILAAP) is the bank's self-proof: strategy, governance, risk identification, measurement, stress, buffers and contingency, attested by the Board and challenged by supervisors. This chapter builds ILAAP and the governance that makes liquidity a managed strategy, not a monitored ratio.
1. Chapter opening
ILAAP documents: business-model liquidity implications, risk appetite with limits, intraday/structural/stress measurement (Chapters 022, 046–049 outputs), buffer adequacy conclusions, contingency funding plan, governance (Board, ALCO, treasury, risk, audit roles), and forward adequacy under strategy and stress. Supervisors assess via SREP liquidity scoring with findings, add-ons (liquidity buffers/sur charges where regimes allow) and required actions. Funding profile (mix, tenor, concentration, currency) is the strategy's fingerprint.
The ILAAP combines analysis, governance and documented conclusions. Deposit pricing changes may affect repricing, migration and retention differently: frequent rate changes do not alone prove balances are unstable. Compare model assumptions to realised behaviour and actual contractual rights, and investigate mismatches through ALCO and independent risk review.
The ILAAP must also address the interaction between liquidity risk and other risks — a credit downgrade triggers derivative margin calls (liquidity impact of credit risk), a market sell-off reduces collateral values (liquidity impact of market risk), an operational incident freezes a payment system (liquidity impact of operational risk). The ILAAP that addresses liquidity in isolation misses the correlations that matter most in stress. This cross-risk lens is what separates a sophisticated ILAAP from a ratio-monitoring report.
2. Learning objectives
- Structure an ILAAP document (strategy → risks → measures → buffers → contingency → governance).
- Read a funding profile (mix, ladders, concentration, currency) as strategy evidence.
- Set liquidity risk appetite with limits, triggers and escalation.
- Design contingency funding plans with credible, tested actions.
- Explain SREP liquidity assessment and finding remediation.
3. Business context
ILAAP quality signals franchise durability to rating agencies (liquidity drives ratings), counterparties (limit-setting reads ILAAP-equivalent disclosures) and acquirers. Funding-profile choices are strategic bets (retail vs wholesale, tenor, currency) with multi-year consequences — ILAAP forces explicit strategy-risk linkage. Governance failures (unclear ownership, untested contingency, Board rubber-stamping) are findings that raise supervisory intensity across all risk types.
Liquidity affects confidence and funding cost, but an ILAAP does not mechanically cause a rating upgrade or a fixed spread saving. In a fictional sensitivity, refinancing 50bn at a spread 25bp lower saves 125m annually (50bn × 0.0025); at 50bp lower it saves 250m. This assumes the whole balance reprices for a full year and excludes fees. Treasury must model actual maturity dates, market conditions and execution capacity.
| ILAAP pillar | Question | Owner |
|---|---|---|
| Strategy & appetite | What liquidity risk do we take, and why? | Board/ALCO |
| Identification | Where does liquidity risk live? | Treasury + Risk |
| Measurement | LCR/NSFR/intraday/stress outputs | Treasury ops |
| Buffers | Adequate for strategy + stress? | ALCO |
| Contingency | What fires, when, tested? | Treasurer |
| Governance | Who decides, challenges, attests? | Board, audit |
4. Finance and accounting view
4.1 Funding-profile reading (fictional)
Fictional funding mix: retail 55%, qualifying operational corporate 15%, wholesale 20% and capital/eligible long debt 10%, totaling 100%. Validate each deposit classification and analyse contractual maturity, renewal, concentration and currency. Internal limits could include no wholesale maturity cliff above 10% per month, top-ten depositors below 10% and asset encumbrance below 15%; these are illustrative appetite limits, not regulatory minima. Some capital instruments are perpetual, but eligibility and redemption features must be assessed. Currency buffers and transferability are evidenced rather than assumed.
Disaggregate the fictional 55% retail funding into current accounts 25%, easy-access savings 20% and term deposits 10%. Analyse insurance coverage, concentration, digital withdrawal speed, pricing sensitivity and contractual early-break rights. Retention percentages are institution-specific stress assumptions, not universal stability rates. Regulatory LCR and NSFR classifications follow their legal criteria; the internal behavioural model does not override prescribed factors.
4.2 Contingency economics
Actions inventoried with size, timing, cost and triggers: repo lines (tested, 5bn/24h — tested quarterly with documented evidence of drawdown and settlement), asset sales (liquid list, haircut-priced — HQLA portfolio with daily mark-to-market, secondary-market liquidity analysis for each asset class, pre-agreed haircut schedules for repo eligibility), central-bank facilities (collateral pre-positioned, stigma-planned — ELA applications prepared with required documentation, collateral eligibility confirmed with the central bank, stigma management plan for market communication), business restrictions (lending freeze, deposit repricing — pre-agreed sequences: first restrict new originations, then reprice existing products, then assess legally permitted product restrictions; existing customer withdrawal rights cannot be changed unilaterally). Trigger ladder: early-warning indicators (spread widening, outflow velocity, rating watch) fire actions progressively — monitored daily in stress, with decision logs.
Cost each contingency action alongside its execution time, legal availability and currency. For a fictional 5bn committed facility, a 5-15bp annual commitment fee would be 2.5m-7.5m, not hundreds of thousands. Actual repo pricing and commitments depend on contract terms; unsecured assurances may disappear in stress. Rank actions by usable cash before the deadline, collateral capacity and confidence effects, as well as cost. Central-bank facilities are not invariably cheapest or accessible, and emergency liquidity assistance is subject to the authority's eligibility and decision.
4.3 Deep dive: funds-transfer-pricing for liquidity and the deposit-franchise valuation
Liquidity-adjusted funds transfer pricing (FTP) allocates tenor funding premiums, buffer carry and contingent funding costs to the businesses creating them. A fictional 10bn buffer yielding 3% funded at 5% has annual negative carry of 200m (10bn × 2%). A 1bn commitment with an internally assumed 30% stressed drawdown creates a 300m funding need; converting that need into a fee requires explicit buffer size, funding spread, time horizon and allocation rules. Regulatory drawdown factors remain separate from internal stress assumptions.
FTP credits stable funding on validated assumptions while pricing withdrawal, renewal and basis risks. Automatic renewal does not guarantee a customer will retain a deposit, and contractual withdrawal options must be reflected. A five-year contract, a five-year modelled retention horizon and a five-year repricing horizon are different attributes.
Deposit-franchise valuation considers future funding-cost advantage, retention, acquisition and servicing costs, customer options and conduct constraints. It is a discounted-cash-flow estimate supported by sensitivities, not a fixed percentage premium. Behaviourally persistent demand deposits remain withdrawable on demand; modelling them for asset funding leaves liquidity risk and does not eliminate contractual maturity mismatch.
5. Product and customer impact
Funding strategy shapes product mix (stable-deposit campaigns, tenor-targeted term products, commitment discipline); contingency restrictions need customer protocols (lending-pause communications, deposit-retention playbooks); concentration limits diversify away from single-depositor dependence (treasurers sometimes turn away hot money — appetite in action).
Apply concentration limits to the relevant depositor or connected group and post-transaction denominator. A new 50m deposit does not automatically breach a 10% single-depositor limit; calculate the resulting share first. Treasury assesses funding tenor, pricing, withdrawal rights and replacement capacity alongside ratio effects. Internal appetite influences product availability, but a strong NSFR alone does not establish excess cash or affordable lending.
6. Regulatory and supervisory view
ILAAP guidelines (including ECB/PRA ILAAP guidance and the separate applicable US/Indian liquidity frameworks) prescribe structure and depth; SREP liquidity scores drive findings, additional buffer guidance and intensified supervision; remediation plans carry deadlines with follow-up examinations. Cross-border groups produce solo + consolidated ILAAPs with transferability analysis (transfer restrictions and legal-entity analysis in Group Consolidation).
The ECB's SREP methodology assigns scores from 1 (low risk) to 4 (high risk), not the reverse. Supervisory decisions may impose quantitative liquidity measures and qualitative remediation according to the bank's deficiencies; there is no automatic six-month remediation rule tied to a score of 2. ILAAP is a bank-owned ongoing adequacy process in the European supervisory framework. Other jurisdictions have their own liquidity-risk and governance requirements rather than one identical global ILAAP submission. ECB SREP methodology.
7. Systems and data view
ILAAP platform: appetite/limit register (version-controlled with change history), measurement engines (LCR/NSFR/intraday/stress — all fed from the same data mart to ensure consistency), buffer-proof packs (asset eligibility, haircut schedules, encumbrance tracking), contingency inventory with testing records (test dates, results, gaps, remediation), finding-remediation tracker (finding ID, owner, deadline, status, evidence of closure), Board-pack generator (automated extraction of key metrics with traffic-light status). Controls: annual refresh with interim triggers (strategy change, stress event, breach — triggered ad-hoc, not just on cycle), versioned assumptions (every ILAAP assumption versioned and linked to the data that supports it), independent review (risk/audit) before Board attestation (audit reviews the ILAAP, not just the numbers).
8. End to end process
- Update strategy and appetite (Board/ALCO-approved strategy with documented risk limits).
- Refresh risks and measurements (LCR/NSFR/intraday/stress outputs on current data).
- Run stresses; conclude buffer adequacy (stress results compared to limits, gaps identified).
- Inventory and test contingency (CFP actions tested on a risk-based programme and applicable requirements, results documented).
- Independent review (risk function and internal audit review before Board).
- Board challenge and attestation (Board minutes evidence genuine challenge — questions asked, answers required).
- Submit; remediate findings on deadline (SREP findings tracked to closure with escalation for slippage).
9. Controls and risks
| Risk | Control | Evidence |
|---|---|---|
| Boilerplate ILAAP | Strategy-linkage review, challenge minutes | Challenge records |
| Untested contingency | Testing calendar with results | Test packs |
| Trapped-liquidity blindness | Transferability analysis per entity | Entity buffer proofs |
| Finding drift | Remediation tracker with dates | Closure evidence |
| Assumption stale | Version control with refresh triggers | Assumption registers |
| Governance rubber-stamp | Board challenge minutes with specific questions | Meeting records |
10. Practical examples
A — Concentration honesty: top-10 share hits 9.5% vs 10% limit; ALCO diversifies pre-breach with term campaigns — appetite working before escalation. B — Finding closed: SREP flags contingency testing gaps; 6-month remediation with quarterly evidence; follow-up closes finding — tracker discipline pays.
10.3 Worked example: concentration limit that saved a quarter (fictional, billions)
Fictional example, billions: total deposits are 100, of which the top ten hold 9.5; the internal early-warning threshold is 9% and limit 10%. Stress assumes 60% withdrawal by that group, producing 5.7 of outflows. If one depositor with 3.5 withdraws 60%, cash outflow is 2.1. Total deposits become 97.9 and remaining top-ten balances 7.4, so the share is 7.56% if membership is unchanged. Replacing 2.1 with wholesale funding at an extra 150bp costs 31.5m annually. Treasury records the deposit withdrawal as Dr customer deposit liability 2.1 / Cr settlement cash 2.1; replacement borrowing is Dr cash 2.1 / Cr wholesale borrowing 2.1. Both entries balance and neither restores the lost deposit franchise.
The concentration limit mechanism reveals a broader principle: early-warning systems must trigger actions, not just alerts. A dashboard showing "top-10 at 9.2%" without associated actions is a monitoring report, not a control. The control is the pre-agreed action set: at 9%, enhanced monitoring activates; at 9.5%, contingency pricing activates; at 10%, new inflows are blocked until the share falls. Each action has an owner, a timeline, and an escalation path. The early-warning becomes a control only when it is linked to pre-authorised responses that execute without requiring committee approval — the committee set the limits; the system enforces them.
11. Diagrams
Figure 1. Funding profile and concentration.
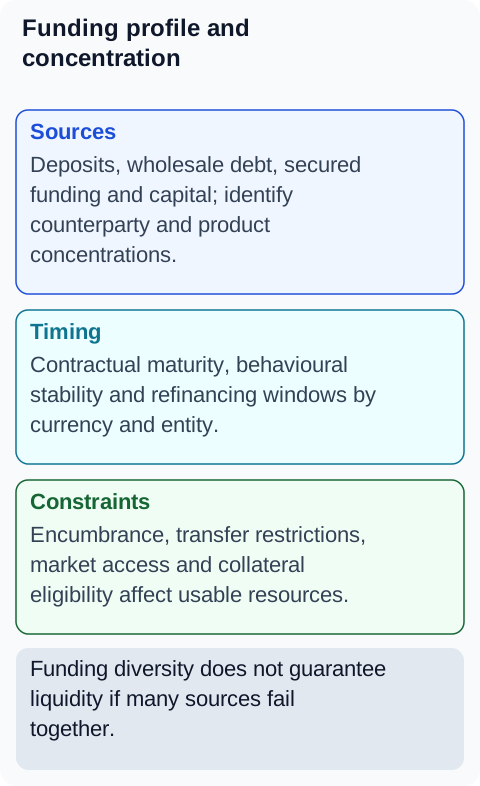 Figure 2. Liquidity stress and survival.
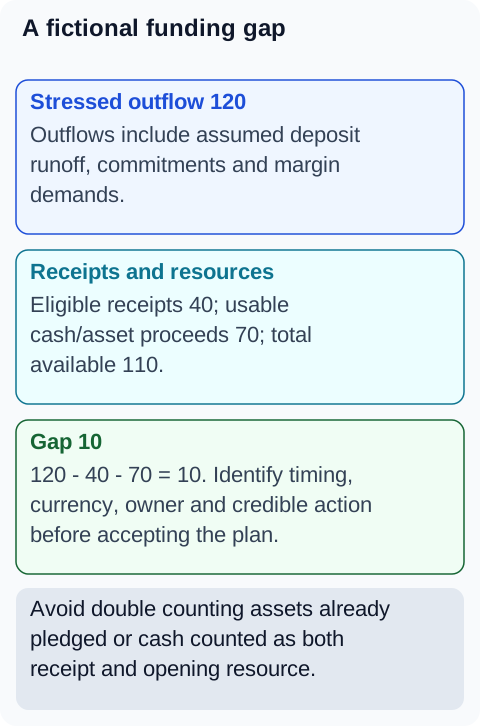
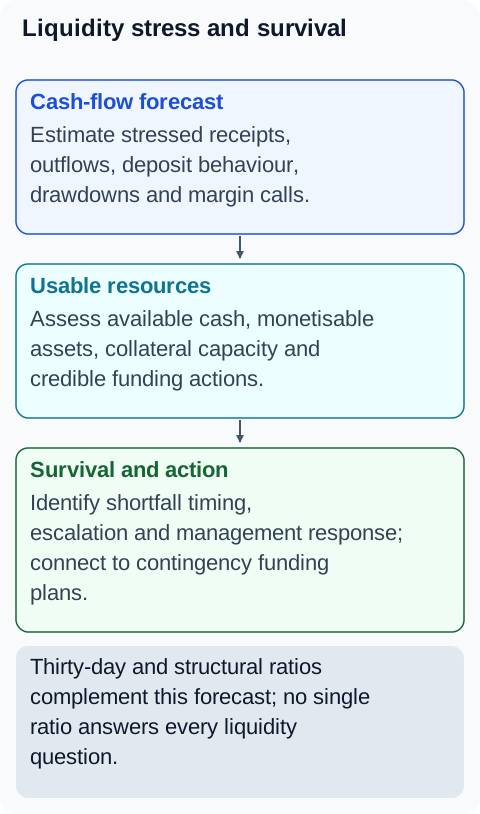 Figure 3. A fictional funding gap.
12. Tables
Table 1 — ILAAP contents map
| Section | Contents |
|---|---|
| Strategy/appetite | Model, appetite statement, limits |
| Risk identification | Funding, intraday, FX, trapped |
| Measurement | LCR/NSFR/intraday/stress outputs |
| Buffers | Adequacy conclusion with evidence |
| Contingency | Inventory, triggers, tests |
| Governance | Roles, challenge, attestation |
Table 2 — Funding-profile health (illustrative limits)
| Metric | Appetite example |
|---|---|
| Retail share | ≥50% |
| Single-month maturity | ≤10% wholesale |
| Top-10 depositors | ≤10% |
| Encumbrance | ≤15% |
13. Illustrative banking case study
The ILAAP nobody read (fictional). Treasury maintains a concentrated wholesale profile while the Board pack reports compliance with stale limits. A stress simulation exposes the gap. Risk challenges the assumption set; ALCO resets limits, tests accessible collateral and assigns remediation owners. The Board receives both the breach and proposed actions. The evidence is the approved appetite, actual funding ladder, stress results and challenge minutes. This is a training scenario, not a documented enforcement episode.
14. BA, developer, tester and operations guidance
- BA: Specify ILAAP structure, appetite metrics, contingency triggers and finding workflows.
- Developer: Version assumptions; link measurements to packs; track findings to closure.
- Tester: Contingency-trigger firing; transferability analyses; pack completeness checks.
- Operations: Refresh on trigger events, not just annually; test contingency like fire drills.
BA teams define metric ownership, review frequency, legal requirements and delegated breach actions. Developers preserve source snapshots and governed assumptions; automation supports rather than replaces review. Testers check complete packs against positions, behavioural assumptions and stresses. Operations rehearse permitted monetisation and funding actions, using actual execution or appropriate controlled simulations; drawing every emergency central-bank facility is neither required nor necessarily possible as a routine test.
15. Common mistakes
- Boilerplate ILAAP disconnected from actual profile.
- Untested contingency presented as ready.
- Entity-blind consolidated-only adequacy.
- Attestation without evidenced challenge.
- Limits tracking history instead of strategy.
- Stress scenarios that never test the assumptions in the ILAAP.
- FTP not reflecting liquidity costs, creating mispriced products.
- Contingency actions ranked by cost, not by execution speed.
16. Key takeaways
- ILAAP = strategy-linked self-proof of liquidity adequacy, Board-attested.
- Funding profile (mix, tenor, concentration, currency) is strategy evidence.
- Contingency needs inventory, triggers, tests — not intentions.
- SREP scores adequacy; findings carry deadlines.
- LCR, NSFR, intraday resources and stress scenarios inform the bank’s liquidity adequacy assessment; none alone guarantees resilience.
17. References and verification notes
- ECB SREP methodology: risk score direction, liquidity adequacy and supervisory measures.
- Basel liquidity risk principles: governance, stress testing and contingency funding; local law determines enforceable duties.