Business Intelligence, Customer Segmentation, and Predictive Analytics
Banks sit on vast oceans of data—every transaction, login, customer service call, loan application, and website click generates information that, properly analyzed, can transform business performance and competitive position in an increasingly crowded market. Data analytics converts this raw information into actionable insights that drive understanding of customer behavior, prediction of risk, optimization of operations, and personalization of services that differentiate leading institutions from laggards. In an era of razor-thin margins and intense competition from both traditional rivals and fintech challengers, the ability to extract value from data has become a primary source of competitive advantage in financial services, separating leaders who can anticipate customer needs and manage risks proactively from those who react to events after they occur.
Banking analytics operates across a hierarchy of sophistication that represents a maturity curve for institutions at different stages of their data journey and technological capabilities. Descriptive analytics addresses the foundational question of what happened, providing historical summaries and reports such as noting that there were ten thousand loan defaults last quarter or that deposits grew by five percent. Diagnostic analytics examines why events occurred, identifying patterns and root causes such as defaults concentrating in personal loans to self-employed borrowers in specific geographic regions or seasonal patterns in customer acquisition. Predictive analytics forecasts what will happen, calculating probabilities such as a specific customer having a forty percent chance of default within six months based on leading indicators and behavioral changes. Prescriptive analytics recommends what actions to take, suggesting specific interventions like reducing a customer's credit limit by thirty percent and offering loan restructuring to prevent default before it occurs. Banks operate at different analytics maturity levels, and a mature institution can use descriptive, diagnostic, predictive and prescriptive techniques together. Predictive sophistication does not automatically create value: reliable source data, clear decisions, controls, adoption and measurable business outcomes matter as much as model complexity.
Customer segmentation has evolved dramatically through data analytics applications, moving from simple demographics to sophisticated behavioral and predictive models that capture the complexity of modern consumers. Traditional segmentation divided customers by simple demographic criteria such as income levels that served as rough proxies for needs and value. Traditional segmentation often used broad income, asset, age or geography bands to approximate customer needs. Exact labels and thresholds vary materially by bank, product and market, so fixed rupee cut-offs should not be presented as universal definitions of mass-market, affluent, high-net-worth or private-banking customers. While simple to implement and explain, this approach missed important variations within segments and failed to predict future behavior or potential value.
Advanced data-driven segmentation adds behavioral and predictive dimensions that provide much richer insight into customer needs and value beyond simple demographics. Behavioral segmentation analyzes transaction patterns to identify spenders versus savers, digital-native users versus branch-dependent customers, and other meaningful distinctions that affect product suitability and channel preference. Lifecycle segmentation considers account age and product usage to distinguish new customers from mature relationships versus those at risk of attrition, enabling appropriate engagement strategies for each stage of the relationship. Value segmentation calculates revenue generated to identify profitable relationships versus those that cost more to serve than they produce, guiding resource allocation toward the most valuable customers. Risk segmentation combines payment history with bureau scores to categorize low-risk versus watch-list customers for differentiated treatment and monitoring intensity. Channel preference segmentation uses app usage and branch visit data to distinguish digital-first customers from those requiring assisted service, informing distribution strategy. Product propensity segmentation analyzes browsing behavior and inquiries to predict which customers are likely to purchase home loans, insurance, or fixed deposits, enabling targeted offers at the moment of interest.
Customer analytics applications span the entire relationship lifecycle from acquisition through retention and expansion, creating value at every stage. Next-best-product analysis predicts which product each customer is most likely to need next based on life stage, behavior patterns, and similarity to other customers, enabling timely and relevant offers rather than generic marketing that annoys customers. Churn prediction identifies customers likely to close accounts or reduce activity based on declining engagement patterns, triggering retention interventions before departure becomes irreversible. Lifetime value calculations estimate total expected revenue from each customer over their entire relationship, guiding acquisition spending and service investment decisions to focus resources on high-value relationships with growth potential. Cross-sell scoring ranks customers by probability of purchasing additional products based on propensity models, optimizing sales force allocation to the most receptive prospects and improving conversion rates. Campaign optimization ensures the right customer receives the right offer at the right time through the right channel, maximizing response rates and return on marketing investment while minimizing waste and customer fatigue.
Risk analytics transforms how banks manage their loan portfolios and operational exposures through data-driven insights that enable proactive management. Credit scoring models predict probability of default for loan applicants using statistical techniques that analyze hundreds of variables, enabling risk-based pricing and approval decisions that balance growth with prudence. Early warning systems detect deteriorating loan quality before actual default occurs by monitoring behavioral indicators and external data, enabling proactive intervention while remedies remain viable and losses can be minimized. Fraud detection identifies anomalous transactions in real time using machine learning that adapts to new patterns, blocking suspicious activity before losses occur and protecting both the bank and its customers. Collections optimization prioritizes which delinquent accounts to contact first for maximum recovery using predictive models of responsiveness, allocating limited collection resources efficiently to accounts most likely to pay. Stress testing models portfolio performance under adverse economic scenarios to ensure capital adequacy and inform strategic planning for potential downturns.
Operational analytics improves efficiency across banking operations through data-driven process improvements that reduce costs and improve customer experience. Branch optimization analysis determines which locations to open, close, or resize based on transaction patterns, demographic trends, and digital migration that is reducing branch traffic. ATM cash planning predicts demand at each location to minimize idle cash while avoiding stockouts that frustrate customers and cause them to use competitor machines. Call center staffing forecasts call volumes by hour and day to schedule appropriate personnel and minimize wait times that damage satisfaction scores. Process mining identifies bottlenecks in loan processing and account opening workflows to streamline operations and improve customer experience by reducing time to yes.
Banks draw on diverse data sources to fuel these analytics applications, each contributing different perspectives on customer behavior and risk that together create comprehensive understanding. Internal structured data from core banking systems provides transaction histories, balances, and product holdings—the foundation of banking analytics that captures what customers do with their accounts. Internal unstructured data including call recordings, emails, and chatbot logs contains rich information about customer needs, complaints, and satisfaction that structured data misses but requires natural language processing to extract. External data from credit bureaus like CIBIL and Experian provides standardized credit assessments, while GST returns and other government data support business lending decisions with objective verification of revenue. Digital footprint data captures app usage, website clicks, and login patterns revealing customer behavior and preferences in real time as they interact with digital channels. Alternative data including mobile phone usage and utility payments helps score thin-file customers with limited traditional credit history who may nonetheless be creditworthy. Public company filings, registries, market information and reputable news can support corporate risk monitoring. Social-media data requires particular caution around provenance, consent, relevance, privacy and reliability and should not be treated as a routine identity-verification or credit-quality source merely because it is publicly visible.
The technology stack enabling banking analytics spans multiple layers that must work together seamlessly to deliver insights to decision-makers. Data storage can use warehouses, lakehouses, data lakes and other architectures, with technology choices shaped by workload, governance, residency, security, cost and existing bank architecture. Product names and architectural patterns evolve, so the important distinction is how data is governed and served rather than which vendor is assumed to be standard. ETL and data processing tools including Apache Spark, Kafka, and Informatica clean and transform raw data for analysis, handling the complexity of banking data sources and formats. Analytics and machine learning employ Python with libraries like scikit-learn and TensorFlow, R, and SAS for statistical modeling and algorithm development that predict outcomes and prescribe actions. Visualization tools like Tableau, Power BI, and Qlik make insights accessible to business users without technical backgrounds through intuitive dashboards and reports. Real-time streaming analytics using Kafka Streams and Flink enable instant decision-making for fraud detection and customer engagement that cannot wait for batch processing. Cloud infrastructure from AWS, Azure, and GCP provides scalable, cost-effective computing resources that adjust to demand without large upfront capital investments.
The evolution of banking analytics continues toward ever-greater sophistication and real-time capability as technology advances and competition intensifies. Artificial intelligence and machine learning can extend predictive and decision-support capabilities, but adoption will vary by use case, regulation, data maturity and risk appetite. Banks should judge analytics by decision quality, control and measurable outcomes rather than assuming that every predictive or prescriptive use case will become standard. Banks that master data analytics will deliver superior customer experiences through personalization that anticipates needs, manage risk more effectively through early detection of problems, and operate with greater efficiency through optimization of resources than competitors still struggling to make sense of the data they possess. The gap between data-driven and intuition-driven institutions will continue to widen, making analytics investment essential for long-term competitiveness in an industry increasingly defined by information advantage.
Visual overview
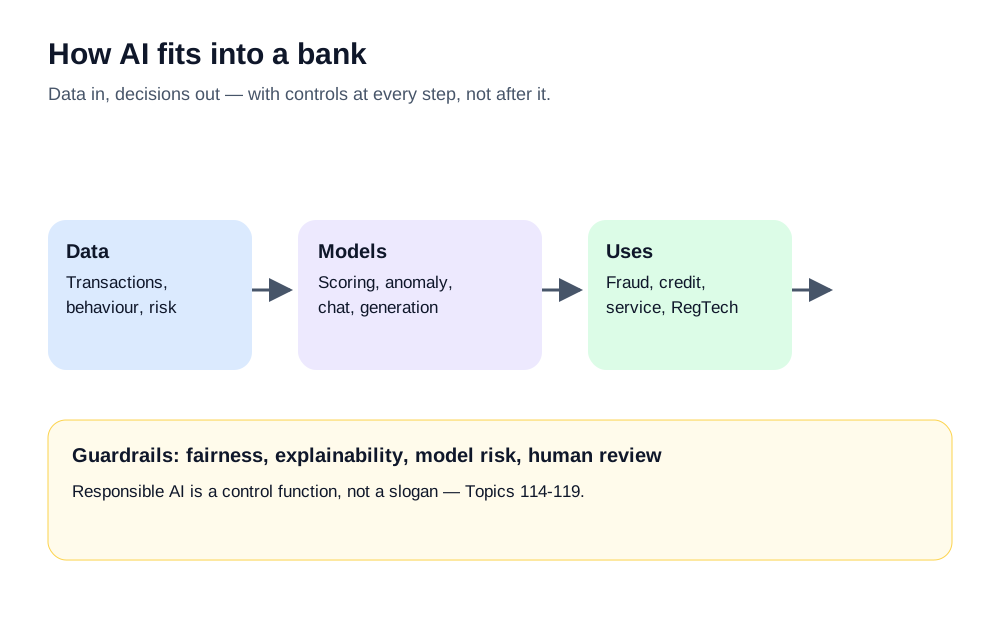
Phase 12 map: data → models → uses, with fairness and control guardrails throughout.
<!-- MBA-DEEP-DIVE-START -->Data Analytics in Banking Deepening — From Source Data to Governed Decisions
Analytics begins with a business decision, not a dashboard
A bank can collect enormous amounts of data and still create little value if teams do not know which decision the analysis is meant to improve. Good analytics starts with a question such as which payment exceptions need attention first, which borrowers show early signs of stress, which branches require more cash, or which customer journeys are failing. The team then identifies the data, metric, timing and action associated with that question. This prevents the common pattern in which dashboards accumulate hundreds of measures that people look at but do not use. A useful analytic product connects observation to responsibility: someone understands the signal, has authority to act and can later measure whether the action improved the outcome.
Source-system meaning should be understood before data is combined
A field called balance, status, customer_id or transaction_date can mean different things across banking systems. A core ledger may store booked balance, a channel may display available balance, and a reporting warehouse may hold end-of-day balance. Combining these without semantic alignment produces misleading analysis even when the technology works perfectly. Data teams should document source meaning, timing, units, currency, business rules and ownership. When a field changes upstream, downstream analytics should know whether the meaning changed. Good analytics governance therefore begins with business definitions rather than assuming that identical column names represent identical concepts.
Data lineage makes an insight explainable
Lineage shows where data originated, which transformations were applied and where the result is used. In banking this matters because a management number can influence pricing, credit limits, regulatory reporting, staffing or customer treatment. If a dashboard shows a sudden increase in failed payments, analysts should be able to trace the measure to the source events and transformation rules. Without lineage, teams can spend days debating whether the business changed or the data pipeline changed. Lineage also supports correction: when a source defect is found, the bank can identify which reports, models and decisions may have been affected.
A data dictionary should capture business language
Technical schemas are useful, but business users need definitions that explain what a measure means in operational terms. “Active customer,” “default,” “churn,” “fraud loss,” “payment success” and “revenue” can each have several valid definitions. A data dictionary should identify owner, calculation, scope, exclusions, effective date and approved usage. This prevents two teams from presenting different values for the same-looking KPI. Where multiple definitions are intentionally required, the distinction should be explicit rather than hidden in SQL code. Shared language is one of the foundations of a data-driven bank.
Data quality should be measured by fitness for use
A dataset can be ninety-nine percent complete and still be unusable if the missing one percent contains the fields needed for sanctions screening or customer contact. Quality dimensions such as completeness, accuracy, timeliness, uniqueness, consistency and validity should therefore be linked to business consequence. A late marketing attribute may be inconvenient, while a late transaction amount can distort liquidity reporting. Critical-data elements deserve tighter thresholds and escalation. Quality rules should identify whether the defect is at capture, integration, transformation or consumption so remediation occurs at the right layer.
Reconciliation is one of the strongest analytics controls
Before trusting complex models, banks should prove that basic totals reconcile to authoritative books and operational records. Transaction counts, amounts, balances and statuses can be compared across source, integration and reporting layers. Reconciliation does not mean every analytical dataset must equal the general ledger at all times; streaming data can be intentionally more current than booked accounting. The difference should be understood and measurable. A known timing difference is data architecture. An unexplained difference is a control problem. Reconciliation builds confidence that later insights are based on a coherent financial reality.
Descriptive analytics establishes the factual baseline
Descriptive analytics answers what happened: how many transactions processed, what value settled, how many customers complained, which products grew and where losses occurred. These measures sound simple but require consistent definitions, correct cut-off times and appropriate dimensional breakdown. A daily payment-success rate can differ depending on whether retries are counted as separate attempts and whether pending transactions are included. Descriptive reporting is therefore not primitive analytics. It is the controlled factual layer on which diagnostic and predictive work depends.
Diagnostic analytics should test causes rather than invent stories
When a KPI changes, people naturally create explanations. A decline in digital logins may be blamed on customer preference, when the real cause is an application-release defect. Diagnostic analytics compares cohorts, channels, time periods and process stages to identify plausible drivers. Analysts should distinguish correlation from causation and test alternative explanations. Operational logs, release calendars, customer feedback and external events can provide context. The objective is to reduce uncertainty enough for action, not to produce a sophisticated narrative unsupported by evidence.
Predictive analytics estimates probability, not destiny
A churn model, fraud model or default model produces an estimate based on past patterns and current features. A high score does not mean the event will certainly happen. Decisions should therefore consider model calibration, threshold, consequence of false positives and available intervention. A customer predicted to churn may stay without action; a borrower predicted to default may recover. The model is useful when it changes the allocation of attention or resources in a way that improves outcomes. Users should understand this probabilistic nature so model scores do not become unquestionable labels attached to customers.
Prescriptive analytics needs constraints and accountability
A model can recommend which action is expected to produce the best outcome, but banking decisions operate within policy, legal, conduct and operational constraints. An optimisation engine might mathematically maximise collections by contacting customers very frequently, while fair-treatment rules require limits. A liquidity optimiser might minimise idle cash while creating unacceptable ATM stockout risk. Prescriptive systems should therefore encode business constraints and leave clear accountability for policy. The “optimal” recommendation is only optimal within the objectives and constraints supplied to the model.
Customer segmentation should reflect use case
There is no single correct segmentation for every bank decision. Marketing may group customers by product propensity, service teams by channel preference, risk teams by behaviour and finance by profitability. Reusing one segmentation simply because it already exists can produce poor decisions. Each segmentation should have a defined purpose, stable features and monitoring. Segments should also be large enough to act on and understandable enough for business users. Highly complex clusters can look mathematically impressive but be useless if no one knows how to treat the customers differently.
Customer lifetime value is an estimate with assumptions
Lifetime value can help banks decide how much to invest in acquisition, retention or service, but it depends on future revenue, cost, churn and product-use assumptions. It should not become a reason to deny basic service to customers with low predicted profitability. Conduct and regulatory obligations apply regardless of projected value. Models should also account for changing relationships; a student with low current balances may become a valuable long-term customer, while a currently profitable customer may leave. Lifetime value is a planning tool, not a permanent ranking of human worth.
Churn models need a precise definition of leaving
A customer can close an account, reduce balances, stop using a card, move salary payments elsewhere or become inactive without formally leaving. Different businesses may define churn differently. The model target should match the intervention. If the bank wants to retain primary-account status, declining salary credits may matter more than legal account closure. A retention team should also know whether the identified customer can realistically be influenced. Some departures result from relocation, company payroll change or product maturity and may not justify costly incentives.
Next-best-action should include “do nothing”
Personalisation systems often assume that every customer should receive an offer. This can create message fatigue and inappropriate sales. A mature next-best-action engine can decide that no commercial contact is currently appropriate. It can prioritise service, fraud protection or financial-health guidance over product sales. Eligibility, suitability, consent, channel preference and recent complaints should constrain the decision. The goal is to make the interaction more relevant, not to turn every data point into a sales trigger.
Campaign measurement needs a control group
If customers who receive a loan offer later borrow more, the offer may have caused the result, or those customers may already have been more likely to borrow. Controlled experiments or carefully designed comparison groups help estimate incremental impact. Banks should also measure negative outcomes such as complaints, opt-outs or later delinquency. A campaign can increase short-term conversion while damaging long-term customer value. Analytics should therefore assess both commercial and customer outcomes.
Branch analytics should account for migration between channels
Falling branch transactions can indicate digital adoption, but it can also reflect poor branch availability, local demographic change or customers leaving the bank. Decisions to resize or close a branch should consider transaction mix, customer vulnerability, cash demand, advisory services, nearby alternatives and regulatory expectations. Digital usage can help identify migration, but not every branch interaction can be replaced by an app. Analytics supports distribution strategy by showing patterns; management still needs to interpret the social and service consequences.
ATM analytics is a forecasting and logistics problem
Cash demand varies by location, salary dates, holidays, weather, nearby events and local business patterns. Too much cash in an ATM creates idle liquidity and security cost; too little causes customer frustration and emergency replenishment. Forecasting can improve denomination mix and refill timing. The model should use realistic service constraints such as route schedules and vault capacity. Performance should measure both stockout reduction and cash efficiency. A forecast that is statistically accurate but impossible for operations to execute has limited value.
Call-centre analytics should preserve context
Call volume, wait time and average handling time are useful, but they do not fully describe service quality. A short call can mean efficient resolution or premature closure. Speech and text analytics can identify recurring complaint themes, confusion after product changes and emotional distress. Privacy and monitoring rules should be respected. Insights should feed product and process teams, not remain only within customer service. Repeated calls about the same payment failure can reveal a system-design issue that no dashboard of call duration will solve.
Process mining can reveal how work actually moves
Banks often document an intended process that differs from the paths taken in production. Event logs can show loops, rework, waiting time and manual hand-offs across account opening, lending, payments or investigations. Process mining is most useful when event timestamps and case identifiers are reliable. The team should interpret the result with operational users because a repeated step can represent necessary control rather than waste. Improvement focuses on unnecessary variation and delay while preserving regulatory and risk requirements.
Payment analytics requires state-aware metrics
A payment can be initiated, validated, accepted, rejected, queued, sent, settled, returned or investigated. Counting all non-completed payments as “failures” can misrepresent the process. Analytics should identify where and why transactions leave the happy path. Rejection codes, channel, scheme, currency, beneficiary bank, cut-off time and system version can reveal patterns. Operations can then target root causes such as bad customer data, insufficient balance, sanctions review, network outage or downstream rejection. Payment success is a lifecycle measure, not a single front-end response code.
Fraud analytics should optimise financial loss and customer friction together
A fraud model can block more suspicious activity by lowering its threshold, but false positives will also rise. Customers may have legitimate cards declined or payments delayed. Analytics should therefore examine fraud capture, prevented loss, false-positive rate, customer contact, abandonment and operational review workload. Different transaction types can require different thresholds. Model performance should be segmented because a rule effective for consumer e-commerce may be unsuitable for corporate payments. The best control balances protection and usability rather than maximising one metric in isolation.
Credit analytics should separate approval, pricing and portfolio management
Origination analytics estimates whether to lend and on what terms. Portfolio analytics monitors risk after the loan is booked. Early-warning models can use payment behaviour, account cash flow or external information to identify deterioration. Collections analytics prioritises treatment after delinquency. These models solve different problems and should not be collapsed into one generic credit score. The data available also changes across the lifecycle. A bank knows relatively little about a new applicant but can observe detailed repayment behaviour after months of relationship.
Early-warning signals should lead to defined actions
A risk score has little value if nobody knows what to do when it rises. Banks should map thresholds to actions such as review, customer contact, limit freeze, enhanced monitoring or restructuring assessment according to policy. Too many alerts can overwhelm teams and create silent backlog. Analysts should measure which signals lead to useful interventions and retire those with low value. Early warning succeeds when it creates enough time for a proportionate action before the risk event becomes irreversible.
Collections analytics should respect fair treatment
Models can estimate contactability, payment probability or expected recovery, helping allocate limited collections resources. They should not recommend harassment or unfairly deprioritise customers who need support. Treatment strategies can distinguish temporary hardship from strategic non-payment and identify customers eligible for restructuring under policy. Outcome analytics should include complaints, promises kept, cure rates and long-term redefault, not only immediate cash collected. Efficient collections is a controlled servicing function, not simply a recovery maximisation exercise.
Treasury analytics depends on high-quality position data
Liquidity, funding and interest-rate decisions require timely balances, expected cash flows and market data. A treasury dashboard that uses stale positions can be more dangerous than no dashboard because it creates false confidence. Intraday analytics can show payment outflows, collateral usage and settlement needs. Forecast models should display uncertainty and allow treasury users to compare scenarios. Reconciliation to official positions is essential. Advanced forecasting does not remove the need for basic position control.
Reconciliation analytics can prioritise breaks by risk
Large banks can have thousands of reconciliation exceptions. Analytics can rank them by amount, age, product, counterparty, recurrence and likelihood of automatic resolution. This helps operations focus on breaks that create financial or customer risk. The model should not permanently deprioritise small amounts if they indicate a systematic defect. Pattern analysis can identify common root causes, such as one interface version or settlement file. Over time, analytics should reduce the creation of breaks, not merely make teams faster at working the same backlog.
Regulatory analytics must remain traceable to source evidence
Data used for regulatory reporting or compliance decisions often needs stronger governance than exploratory analysis. Definitions, transformations, approvals and adjustments should be documented. Analysts should distinguish an official regulatory number from an internal proxy. If a model supports transaction monitoring, sanctions or prudential decisions, validation and change control should reflect the consequence of error. Regulatory analytics is not simply another dashboard because external accountability can depend on the result.
Data warehouses and lakehouses serve different access patterns
Banks can store curated structured data in warehouse-style models while keeping larger raw or semi-structured datasets in lake or lakehouse architectures. The labels matter less than governance. Sensitive fields should have access control, retention and masking. Data should not be copied into every analytic sandbox without tracking. Curated reusable data products can reduce inconsistent transformations. Architecture should support both performance and evidence: users need fast analysis, while the bank needs to know where the data came from and who can see it.
Streaming analytics changes the timing of decisions
Batch analytics can be appropriate for monthly profitability or overnight risk reporting. Fraud detection, customer authentication and some payment monitoring require decisions in seconds or milliseconds. Streaming architectures process events as they occur and maintain state across recent activity. This creates operational complexity around duplicates, late events, ordering and replay. Real-time does not mean perfectly instantaneous; the bank should define acceptable latency and consistency. A streaming decision should still be reconstructable later from retained events and model versions.
Event time and processing time can tell different stories
A transaction can occur at one time and arrive in the analytics platform later because of network or system delay. If analysis uses only processing time, activity can appear in the wrong sequence. Event-driven systems should preserve business timestamps and ingestion timestamps. This is particularly important for fraud investigations, payment cut-offs and service-level measurement. Analysts should understand which clock a metric uses. Time is a data field with business meaning, not merely a technical timestamp.
Data privacy should shape feature selection
A feature can improve model accuracy and still be inappropriate to use. Banks should assess purpose, proportionality, consent or other legal basis, sensitivity, retention and potential harm. Data collected for one service should not automatically be used for every analytic experiment. Privacy-preserving approaches can reduce exposure through aggregation, masking, tokenisation or controlled environments. The most mature analytics programme asks not only whether data can predict an outcome but whether the bank should use it for that decision.
Access control should follow business need
Analysts do not need unrestricted access to all customer data simply because they work with data. Role-based or attribute-based access, masking and approved environments can limit sensitive information. Development and testing should avoid uncontrolled production copies. Privileged access should be logged and reviewed. These controls can coexist with productive analytics when curated datasets and secure tooling are designed well. Security that forces teams to export data to personal spreadsheets is not successful security.
Model features should be stable enough for production use
An experimental variable can correlate strongly with an outcome but be unavailable, delayed or inconsistent in production. Feature engineering should consider operational reliability. A credit model depending on a field produced manually once a month may not work for real-time origination. A fraud feature derived from a partner API can fail when the partner is unavailable. Models need defined fallback behaviour when features are missing. Production analytics is a service, not only a statistical artifact.
Feature stores can improve consistency when governed well
A feature store can centralise reusable variables such as recent transaction count, average balance or device age so different models calculate them consistently. The benefit disappears if feature definitions are unclear or ownership is weak. Training and production computation should match to avoid training-serving skew. Versioning helps reconstruct historical decisions. Feature stores are therefore valuable when they support semantic and operational consistency, not merely because they are a modern architecture component.
Experimentation needs customer and risk guardrails
Banks can use A/B testing for interface design, messaging or some product features, but not every financial control is suitable for unconstrained experimentation. Tests should define what can vary, who is eligible, what harms are monitored and when the experiment stops. A test that improves click-through but increases mistaken payments is not successful. Compliance and risk teams should be involved where customer outcomes or regulated obligations are affected. Controlled experimentation is strongest when it speeds learning without treating customers as unprotected test subjects.
Causal inference helps when randomised testing is not practical
Many banking questions cannot be tested with a simple experiment. Analysts can use matched comparisons, natural experiments or other causal techniques to estimate impact, but assumptions should be transparent. Correlation between branch closure and digital adoption, for example, does not prove the closure caused adoption; both may result from a broader regional strategy. Decision-makers should understand uncertainty. Analytics becomes more credible when it states what the evidence supports rather than presenting every relationship as causal.
Scenario analytics complements prediction
A model may predict the most likely outcome, while risk management often cares about plausible adverse outcomes. Scenario analysis asks what happens if unemployment rises, a payment network is unavailable, deposit outflows accelerate or market rates move sharply. The scenario does not need to be a forecast to be useful. It helps management understand sensitivity and contingency needs. Combining predictive and scenario approaches prevents the bank from optimising only for the average future.
Dashboard design should highlight decision thresholds
A management dashboard should help users see what changed, why it matters and where action is required. Excessive charts can hide important signals. Measures should include context such as target, previous period, threshold or confidence range. Users should be able to drill to relevant dimensions without accessing unnecessary personal data. Alerts should be reserved for genuinely actionable conditions. A dashboard becomes operational infrastructure when teams trust its definitions and use it in regular decision routines.
Data storytelling should preserve uncertainty
Executives often need concise explanations, but simplification should not remove uncertainty or limitations. Analysts should distinguish fact, estimate and interpretation. A forecast can show a range rather than a single point. A model comparison can explain sample period and population. Visual design should not exaggerate small differences through misleading axes or selective time windows. Clear communication is a control because important decisions can be distorted by presentation even when underlying calculations are correct.
Analytics governance needs named owners
Critical datasets, models and KPIs should have accountable owners who approve definitions, resolve quality issues and manage change. Data governance cannot be delegated entirely to a central office; business domains understand meaning while technology teams understand pipelines. Shared stewardship connects the two. Governance forums should focus on material problems and decisions rather than producing catalogues no one uses. Ownership is strongest when defects have a clear escalation path and correction deadline.
Model monitoring should include data drift and outcome drift
A model can degrade because customer behaviour changes, the economy changes, source data shifts or an upstream system is redesigned. Monitoring should compare feature distributions, score distributions, decision rates and realised outcomes with development expectations. Not every change requires retraining; teams should investigate whether the drift is meaningful and whether the model remains fit for purpose. Version changes should be controlled and tested. Continuous monitoring turns analytics from a one-time project into a managed production capability.
Human override should be visible and reviewable
Some decisions allow authorised staff to override a model or analytic recommendation. Overrides can correct exceptional cases, but frequent overrides can indicate poor model fit or inconsistent policy. Systems should record who overrode, why and what the outcome was. Analytics can then identify patterns by team, segment or rule. The objective is not to eliminate human judgment but to make it accountable and learn from it. Hidden manual intervention prevents accurate evaluation of both model and process.
A payment-operations scenario shows the value of joined data
Suppose payment rejects rise sharply after a channel release. A descriptive dashboard shows the increase, diagnostic analysis finds concentration in one initiation route, process data links the failures to a newly populated beneficiary field, and release metadata identifies the deployment. Operations can isolate the affected flow, technology can correct the mapping and reconciliation can identify customer transactions requiring repair. No machine learning is needed. The value comes from consistent references and the ability to connect business, technical and operational data quickly.
A credit scenario shows why predictive scores need action design
An early-warning model flags a business borrower because account inflows have fallen, overdraft usage has increased and scheduled repayments are approaching. The relationship team reviews the evidence and contacts the customer. They learn that a major receivable is delayed but the business remains viable. The bank may monitor more closely or consider an appropriate restructuring under policy. The model created time for a better decision; it did not decide automatically that the customer must default. This is the practical purpose of predictive analytics.
The final analytics test is whether data improves a controlled decision
Banks do not become data-driven by collecting more information or deploying more sophisticated algorithms. They become data-driven when trustworthy data reaches the right decision at the right time, the user understands what it means, action is consistent with policy and the outcome is measured. Source semantics, quality, lineage, privacy, model governance and operational adoption are therefore part of analytics, not separate compliance work. The strongest analytics capability makes banking decisions more explainable and repeatable while still recognising uncertainty and human accountability.
Data Analytics Final Depth — Measurement, Controls, and Production Discipline
KPI ownership prevents silent definition drift
A bank can use the same KPI for years while its underlying calculation changes through new products, channels or systems. Each material KPI should therefore have a named business owner, technical lineage and controlled definition. If “active customer” changes from one transaction in ninety days to one transaction in thirty days, historic comparisons should not continue as if nothing changed. Versioned definitions and effective dates preserve continuity. This is especially important when executive incentives, regulatory commitments or strategic targets depend on the measure.
Metric hierarchies should connect executive outcomes to operating causes
A top-level measure such as payment success, customer retention or cost-to-serve becomes more useful when teams can decompose it into drivers. Payment success can be broken down by validation rejection, insufficient funds, fraud intervention, network error and downstream rejection. Retention can be broken down by customer segment, product, service issues and competing offers. A hierarchy helps management avoid acting on the headline without knowing what can actually be changed. It also prevents separate teams from optimising local metrics that harm the overall outcome.
Data freshness should be explicit
A dashboard can show a current timestamp while some underlying sources are hours or days old. Users should know the freshness of critical datasets and whether a metric is intraday, end-of-day or month-end certified. A treasury position, fraud signal and annual profitability report have different timing needs. If a source misses its expected delivery, the analytic product should flag staleness rather than silently displaying yesterday's value as current. Freshness is part of data quality because a correct value delivered too late can still produce a wrong decision.
Restatements should be governed rather than hidden
Banking data can be corrected after initial reporting because late transactions, accounting adjustments or source defects emerge. Restatement policy should identify which reports are updated, whether historic values are preserved and how users are notified. A dashboard that rewrites history without explanation can make previous management decisions impossible to reconstruct. Certified reporting can therefore retain original and restated values where appropriate. Transparency around correction builds trust in analytics rather than weakening it.
Master and reference data affect nearly every analytic domain
Customer identifiers, product codes, branch hierarchies, currencies, countries, merchant categories and counterparty identifiers are reused across analysis. If reference mappings are inconsistent, the same transaction can be classified differently by risk, finance and operations. Governance should control effective dates and retired codes. Mergers, branch closures and product migrations require particular care because historic reporting may need the old hierarchy while current operations use the new one. Reference data is often less glamorous than machine learning but has enormous influence on whether analysis agrees across the bank.
Entity resolution helps join fragmented customer relationships
A customer can appear under several identifiers across deposits, cards, lending and acquired systems. Analytics may need an enterprise view, but matching should be controlled. Name and address similarity alone can create false matches, while strict exact matching can leave one customer fragmented. Banks can use verified identifiers and probabilistic matching with confidence thresholds, preserving source IDs. Entity resolution should not overwrite legal-account records; it creates an analytic linkage with evidence. Incorrect merging can expose another person's information or distort risk exposure.
Corporate hierarchies need separate analytical treatment
A corporate group can contain parents, subsidiaries, branches, special-purpose vehicles and joint ventures. Credit, revenue and payment analysis may need both legal-entity and group views. The hierarchy can change over time. A single current parent mapping is insufficient for historical exposure analysis because an entity may have belonged to another group when a loan was originated. Effective-dated relationship data helps risk teams reconstruct concentration and connected exposure. Corporate analytics therefore depends heavily on mastered legal-entity data.
Geographic analysis should not confuse branch location with customer location
A transaction can be booked in one branch, initiated in another country and belong to a customer registered elsewhere. Geography should therefore be defined according to the question. Fraud teams may care about device or merchant location, finance may care about booking entity and marketing may care about residential address. Maps can look convincing while mixing these meanings. Data products should label geographic dimensions precisely to prevent incorrect conclusions about regional performance or risk.
Cohort analysis distinguishes age effects from period effects
Customers or loans acquired in one month can be followed over time to understand behaviour as they mature. This helps separate a weak origination vintage from a broad economic downturn affecting all vintages. Digital-product cohorts can reveal whether new users retain activity after promotional incentives end. The cohort definition and observation window should be stable. Cohort analysis is especially useful when aggregate averages hide the fact that a recent growth wave behaves differently from established relationships.
Funnel analytics should preserve the reason for customer drop-off
An onboarding funnel may show customers moving from application start to identity check, product selection, acceptance and account activation. A drop at one step can reflect abandonment, technical failure, policy decline or fraud block. Treating all exits as customer abandonment leads to the wrong remedy. Events should therefore record business outcome as well as screen navigation. Product teams can improve genuine usability problems without weakening controls that correctly stop ineligible or fraudulent applications.
Service-level analytics should separate waiting from processing
A loan may take three days end to end while actual processing consumes only two hours; the rest can be customer waiting, queue time, external dependency or manual approval delay. Event timestamps can reveal where elapsed time accumulates. This helps operations target bottlenecks rather than asking every team to “work faster.” Service-level metrics should also consider customer impact and regulatory deadlines. Faster is valuable when quality remains controlled.
Cost analytics needs transaction and activity drivers
Allocating all technology or operations cost evenly across products can hide which activities actually consume resources. Activity-based analytics can connect cost to calls, investigations, manual exceptions, cash handling or compute usage. This helps management see that a low-revenue product may be profitable if automated, while a high-volume product may generate substantial manual cost through poor data quality. Cost analysis should be good enough to support decisions without becoming an impossible attempt to allocate every shared expense perfectly.
Profitability should be risk-adjusted where relevant
A lending segment with high interest revenue may look attractive before credit losses, capital and collections cost are considered. A payments relationship may have low transaction fees but valuable deposits or foreign-exchange activity. Analytics should therefore define the level at which profitability is assessed and include material risk and service costs. Customer-level profitability estimates are useful for strategy but should not become a reason to provide unfairly poor service to low-value customers. Regulatory and contractual obligations remain independent of profitability scores.
Forecast evaluation should compare against simple baselines
A sophisticated machine-learning forecast should outperform reasonable alternatives such as recent average, seasonal pattern or established statistical method. If it does not, complexity may not be justified. Forecast accuracy should be measured over realistic horizons and periods, including stress. Teams should also examine whether the error matters operationally. A small numerical improvement that does not change cash planning or staffing decisions may have little business value.
Confidence intervals communicate uncertainty better than point forecasts alone
Liquidity, call volume, cash demand and credit loss cannot be predicted perfectly. Showing a range helps users plan buffers and contingencies. The width of the interval should reflect historical uncertainty and model assumptions. Users should understand that a ninety-five-percent interval is not a guarantee that every future value will fall inside it. Uncertainty communication reduces the temptation to treat forecasts as deterministic budgets.
Backtesting should mimic the real decision timeline
When evaluating historical predictive models, teams should use only information that would actually have been available before the predicted event. Backtests that use revised or future data create false confidence. The same principle applies to trading, fraud and liquidity analytics. Data snapshots and versioned features can support realistic historical simulation. A model should earn trust under the same information constraints it will face in production.
Alert thresholds should be tuned to human capacity
An analytic system that produces thousands of daily alerts can fail even if every alert is statistically reasonable. Teams have limited review capacity, and excessive noise causes important cases to be ignored. Thresholds should consider risk severity, false-positive cost and operational capacity. Queue analytics can track ageing and outcome. The objective is not to maximise alerts; it is to surface a manageable set of cases where intervention can change the result.
Feedback loops should capture what happened after intervention
If a model sends customers to manual review, the bank should record the review result and later outcome. If a retention offer is made, the bank should know whether the customer stayed. If an ATM forecast triggers extra cash, the system should measure whether stockout was avoided. Feedback turns analytics into learning. Without it, teams repeatedly generate recommendations without proving whether they help. Feedback data should also distinguish intervention effects from natural outcomes.
Analytics documentation should be proportional to consequence
An exploratory notebook used for a one-time internal question does not need the same governance as a model setting credit limits. Banks can define tiers based on financial, regulatory, customer and operational impact. Higher-impact analytics need stronger validation, testing, access control and change management. This risk-based approach avoids applying heavyweight governance to every spreadsheet while ensuring consequential decisions receive appropriate oversight.
The strongest data culture values correction over certainty
A data-driven organisation should be willing to change its view when evidence changes. Analysts should be able to challenge popular narratives, report data defects and explain uncertainty without pressure to produce the desired answer. Management should distinguish an honest corrected metric from poor performance. The purpose of analytics is not to make every decision look scientific; it is to make evidence more reliable, transparent and useful. A culture that punishes inconvenient data will eventually create dashboards that confirm beliefs rather than improve banking.
<!-- MBA-DEEP-DIVE-END -->