Visual overview
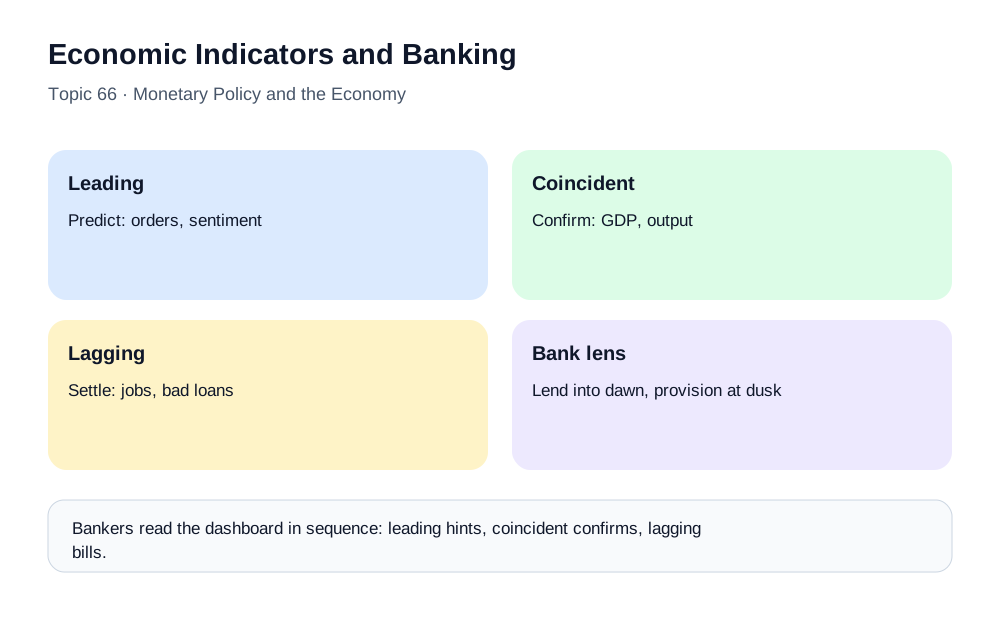
Economic Indicators and Banking at a glance — GDP, unemployment, business cycles.
The Dashboard Bankers Watch to Predict the Future
Economic indicators serve as the essential dashboard that bankers monitor to anticipate changes in the business environment, guiding decisions about credit policy, provisioning, asset allocation, and strategic planning. These data points, ranging from high-frequency daily market indicators to monthly employment statistics to quarterly national accounts, provide signals about where the economy has been, where it currently stands, and most importantly, where it is heading. For banking professionals, proficiency in reading these signals distinguishes reactive institutions that merely respond to events from proactive ones that position themselves advantageously ahead of cyclical turns. The sophistication with which a bank analyzes and acts upon economic indicators often correlates directly with its long-term profitability and risk management effectiveness.
This topic builds the complete dashboard. We begin with the first-principles question — why banks, uniquely among businesses, must forecast the whole economy rather than just their own market — then work through the three timing categories of indicators, the major data series one by one, the business cycle mechanics that connect indicators to bank profit and loss, the procyclicality trap, and the systematic ways banks embed indicator analysis into credit policy, provisioning, and stress testing. The goal is not to turn you into an economist but into a professional consumer of economic data: someone who knows which release matters, why it moves markets, what it predicts for loan books, and when the consensus reading is wrong.
What you will learn in this topic:
- Why banking outcomes are hostage to the macroeconomy in a way other industries are not
- The leading / coincident / lagging classification and how it dictates each indicator's use
- How to read GDP, inflation, employment, and PMI releases like a practitioner
- Which market-based indicators — yield curves, credit spreads, funding spreads — warn earliest
- How the business cycle transmits into bank earnings, and why banks amplify cycles instead of damping them
- How real estate, currency, and trade indicators map to specific portfolio risks
- How banks operationalize indicators in credit policy, provisioning, ALM, and stress testing
- The limits of indicator analysis — false signals, revisions, and broken correlations
1. First Principles: Why a Bank Needs an Economic Dashboard
Most businesses can succeed by understanding their own industry deeply. A restaurant chain needs to know food costs, foot traffic, and local competition; if the national economy wobbles, it adjusts. Banks do not have this luxury, for a structural reason: a bank's product is the economy's future. Every loan is a bet on the borrower's income over coming years, and borrower income — wages, profits, property values, export earnings — is generated by the macroeconomy. When the economy turns, thousands of apparently unrelated borrowers deteriorate together. This correlation is the defining feature of credit risk: diversification within a portfolio cannot remove it, because the common factor is the cycle itself.
The balance sheet compounds the exposure. Banks hold government bonds whose prices fall when inflation surprises; they fund short and lend long, so interest rate paths set by central banks responding to the economy determine their margins; their collateral — property, inventory, receivables — reprices with the cycle. Even a bank with flawless underwriting standards earns and loses with the macro environment, because the standards were calibrated to a forecast. A bank that believed 2021's growth and rates would persist priced thirty-year mortgages on that belief; the forecast was the product.
It follows that economic indicators are not background reading for a bank — they are production inputs, as operational as core banking software. Credit committees tighten or loosen standards based on them. Provisioning models translate them into loss reserves. Asset-liability committees set duration based on them. Strategic planners choose markets and products based on them. And regulators, since the post-2008 stress-testing regimes, require banks to demonstrate that their capital survives specified indicator scenarios. Reading the dashboard is not an analyst's hobby; it is a licensed activity.
A final framing point before the taxonomy: indicators are measurements of a complex system, and like all measurements they are noisy, revised, and occasionally wrong. The professional skill is not memorizing what each number means but understanding what each number can and cannot tell you — its frequency, its lag, its revision pattern, its failure modes. That judgment, more than any single data point, is what this chapter builds.
2. The Timing Taxonomy: Leading, Coincident, Lagging
Economic indicators fall into three fundamental categories based on their timing relative to the business cycle, a classification that determines how bankers use them for forecasting and decision-making.
Leading indicators provide early signals of impending economic changes before those changes actually occur, making them invaluable for predictive purposes. These indicators include purchasing managers' indices that survey business sentiment and ordering activity, yield curve slopes that reflect market expectations of future interest rates, stock market indices that incorporate investor expectations about corporate profitability, and building permits that signal future construction activity. Because leading indicators anticipate rather than confirm economic shifts, they inevitably generate false signals and require interpretation within broader analytical frameworks, but their predictive value makes them essential inputs to bank planning processes. The old joke that stock markets have predicted nine of the last five recessions captures the trade-off precisely: leading indicators fire early because they fire often. The professional response is not to discard them but to require confirmation — one leading indicator turning is noise; three turning together, across different methodologies, is a signal worth provisioning against.
Coincident indicators move simultaneously with the overall economy, providing real-time confirmation of current economic conditions rather than advance warning of changes. Gross domestic product, the broadest measure of economic output, serves as the definitive coincident indicator, though its quarterly frequency and subsequent revision make it less useful for immediate decision-making than higher-frequency alternatives. Industrial production indices track manufacturing and utility output in near real-time, offering more timely insight into economic momentum. Employment levels, particularly the payroll employment series, provide coincident confirmation of economic health since businesses adjust staffing in response to current demand conditions. These coincident measures tell bankers where the economy stands today, validating or contradicting expectations derived from leading indicators.
Lagging indicators confirm trends only after the economy has already changed direction, making them less useful for prediction but valuable for validating that observed changes represent genuine trends rather than statistical noise. The unemployment rate, perhaps counterintuitively, typically lags the business cycle because businesses hesitate to lay off workers during initial demand softness and delay hiring until recovery appears sustainable. Inflation measures similarly lag economic activity, as price pressures build during expansions and moderate only after contractions have reduced demand pressures. Bank non-performing assets lag the cycle because loan performance deteriorates only after economic weakness has persisted long enough to impair borrower cash flows. These lagging indicators help bankers confirm that cycle turns have genuinely occurred and guide provisioning decisions for credit losses that materialize with delay.
| Category | Examples | Banker's use | Key limitation |
|---|---|---|---|
| Leading | PMI, yield curve slope, building permits, equity indices | Tighten/loosen credit policy early; strategic positioning | False signals; requires cross-confirmation |
| Coincident | GDP, industrial production, payroll employment | Confirm current conditions; validate forecasts | Revisions; quarterly GDP is slow |
| Lagging | Unemployment rate, inflation, NPA ratios | Confirm turns; guide provisioning and workout planning | Too late for prevention; planning only |
Notice that the same economy produces all three simultaneously — at any moment there are leading indicators pointing one way and lagging indicators pointing another. The dashboard is contradictory by construction, and synthesis, not selection, is the discipline.
3. GDP: The Master Coincident Indicator
Gross domestic product deserves particular attention as the broadest standard measure of economic production, but it is not a universal official 'arbiter' of recession dating. Statistical agencies publish GDP using country-specific release and revision schedules, and early estimates can be revised materially as more complete data arrive. Two consecutive quarters of negative real GDP growth are a widely used shorthand for a technical contraction, not a universal legal or economic definition of recession. Some countries and analytical institutions assess recession using a broader set of output, income, employment, sales, and other indicators. Banking analysis should therefore use GDP as an important coincident measure while retaining the underlying monthly and sector data that reveal stress earlier.
For banking operations, GDP growth drives loan demand as businesses expand operations and consumers increase spending during expansions, while contractions trigger credit quality deterioration and provisioning increases. The relationship is roughly proportional and remarkably stable: corporate loan growth tracks nominal GDP growth because credit finances the activity GDP measures. Banks monitor GDP components, distinguishing between consumption-driven growth that supports retail lending and investment-driven growth that drives commercial banking opportunities. An expansion powered by government spending or exports generates different loan-book opportunities — and different risks — than one powered by household consumption or corporate capital expenditure.
Two practitioner refinements matter. First, nominal versus real: banks live in nominal magnitudes — loans are repaid in currency units, not inflation-adjusted ones — so nominal GDP, not the headline real figure, is the better proxy for debt-service capacity. Second, expectations versus outcomes: markets and credit committees price the forecast, so the banking impact of a GDP release comes from the surprise relative to consensus, not the level. A 2 percent print expected at 4 percent tightens credit conditions more than a 2 percent print expected at 1 percent.
4. Inflation Indicators: The Policy Trigger
Inflation indicators, primarily the Consumer Price Index and its variants, guide both central bank policy expectations and bank asset-liability management decisions. CPI measures track price changes for a representative basket of consumer goods and services, with weights reflecting typical household expenditure patterns. Core inflation measures that exclude volatile food and energy components help identify underlying inflation trends obscured by temporary commodity price swings — a hurricane that doubles vegetable prices moves headline CPI without signaling anything about the economy's inflationary process. Personal Consumption Expenditure deflators, preferred by the United States Federal Reserve, offer alternative measurement approaches that some argue better capture consumer welfare impacts, partly because their weights update as consumers substitute between goods.
For banking, inflation influences net interest margins through its effect on central bank policy rates, credit demand through its impact on real purchasing power, and asset quality through its complex effects on borrower cash flows. Banks must distinguish between inflation driven by robust demand, which may accompany strong loan growth, and supply-shock inflation, which may accompany stagflationary weakness. Demand-pull inflation means borrowers are busy and revenues are rising — credit quality often improves even as rates rise. Cost-push inflation squeezes margins, erodes real wages, and degrades loan performance while simultaneously forcing the central bank to tighten: the worst configuration for a bank, and the reason the 1970s stagflation and the 2021–22 supply-shock episode occupy such prominent places in banking risk memory. The inflation chapter of this curriculum covers the measurement and transmission mechanics in depth; here the point is narrower: inflation is the indicator that most directly determines what the central bank does next, and what the central bank does next determines the bank's margin.
5. Employment Data: The Consumer Credit Crystal Ball
Employment data provides crucial insight into consumer financial health and loan performance prospects. The unemployment rate measures the percentage of the labor force actively seeking but unable to find employment, with increases signaling economic weakness and household stress. Non-farm payrolls in the United States, reporting monthly changes in employment levels, constitute one of the most market-moving economic releases due to their timeliness and reliability — the first Friday of each month reprices rate expectations globally within seconds of release.
For banking, employment trends directly affect consumer loan performance, with rising unemployment triggering increased delinquencies on mortgages, auto loans, and credit cards. The mechanism is direct and lagged by roughly one to three months: a borrower who loses a job typically exhausts savings before missing payments, so the delinquency curve trails the layoff curve with predictable geometry. Employment data also guides strategic decisions about market expansion, with banks prioritizing growth in regions with strong employment creation while retreating from areas experiencing job losses.
Practitioners read beneath the headline. The unemployment rate can fall for the wrong reason — discouraged workers leaving the labor force — so participation rates and employment-population ratios provide the cross-check. Wage growth data matters doubly: it signals both household debt-service capacity (good for credit quality) and inflation pressure (bad for rate expectations). Sectoral composition matters as well: job losses concentrated in construction signal housing-cycle stress, while broad-based losses signal general recession, and each maps to different portfolio segments.
6. PMI: The Practitioner's Favorite Leading Indicator
The Purchasing Managers' Index offers particularly valuable leading information due to its monthly frequency and forward-looking survey methodology. Rather than measuring what happened, PMI surveys ask purchasing managers — the people who order inputs for production — what they are doing now: new orders, production, hiring, delivery times, inventories. Because orders precede output and output precedes earnings, the index anticipates the real economy by one to two quarters. PMI readings above fifty indicate expansion in manufacturing or services activity, while readings below fifty indicate contraction. The index components provide granular insight into new orders, production, employment, supplier deliveries, and inventories, enabling detailed analysis of economic dynamics — the new-orders component alone is among the best single leading series available anywhere.
For banking, PMI trends anticipate loan demand and credit quality changes, with deteriorating PMI readings signaling the need for tightened credit standards and increased provisions well before these needs become apparent in actual loan performance data. A credit committee watching three consecutive monthly PMI declines — particularly in new orders — can reprice risk six months before delinquencies validate the decision. That head start is the entire economic value of leading indicators: not certainty, but earlier optionality. The limitation is honesty about scope: PMIs survey sentiment and intentions, and sentiment can be wrong, as post-referendum and post-pandemic episodes of gloomy surveys followed by resilient activity demonstrated.
7. The Business Cycle and the Bank's P&L
Business cycles profoundly shape banking outcomes through mechanisms that every banker must understand. During expansion phases, rising GDP, low unemployment, and strong credit growth create favorable conditions for bank profitability, with loan demand increasing, provisioning requirements declining, and collateral values appreciating. Banks experience pressure to compete aggressively for market share during these periods, potentially compromising credit standards in pursuit of growth. Peak phases find economies operating at maximum capacity, with banks achieving highest profitability but also building unrecognized risks as competitive pressure peaks and underwriting discipline potentially relaxes — the loans that default in the next recession are disproportionately the ones made in the final year of the boom, a pattern so regular that vintage analysis is standard risk practice. Contraction phases bring falling GDP, rising unemployment, and deteriorating credit quality, with non-performing assets increasing, provisioning requirements rising sharply, and loan demand collapsing. Trough phases represent maximum stress for banks, with peak non-performing loans and minimum valuations, though recovery prospects begin to emerge as the cycle prepares to turn.
The dashboard's purpose is precisely to locate the bank on this clock. Leading indicators rolling over at a peak is the signal to stop competing on looseness; coincident indicators confirming contraction is the signal to provision; lagging indicators peaking is, counterintuitively, often the signal that the worst is being recognized and priced — and that recovery positioning can begin.
8. Procyclicality: Why Banks Make Cycles Worse
The procyclicality problem describes how credit availability, risk perception, collateral values, and bank behaviour can amplify business cycles. During booms, low realised losses and rising asset prices can make risk appear smaller, encouraging balance-sheet expansion and easier credit. During downturns, losses, falling collateral, funding pressure, and capital constraints can lead institutions to tighten simultaneously, reinforcing economic weakness. The strength of this mechanism varies by banking system and policy response, but it is an important reason prudential frameworks include countercyclical tools.
Basel III provides a framework for authorities to activate a countercyclical capital buffer when system-wide cyclical risk is judged to be elevated and to release or reduce the buffer when conditions warrant. It should not be described as an automatically positive extra buffer in every expansion. Expected-loss accounting, forward-looking provisioning, stress testing, and other prudential tools can also reduce delayed recognition of deterioration, although none removes the credit cycle entirely. For the individual banker, the lesson is that the dashboard exists partly to fight instinct: the cycle's most dangerous moment is the one that feels safest, and the indicators are the objective check on competitive euphoria.
9. Market-Based Indicators: Where the Smart Money Speaks First
Interest rate indicators provide crucial signals about monetary policy expectations and fixed income market conditions, and they share a decisive advantage over statistical releases: they are continuous, unrevised, and generated by participants with money at stake. The yield curve shape, plotting yields across maturities, embeds expectations about future short-term rates together with inflation, term premia, supply-demand effects, and market structure. Certain curve inversions have historically been associated with elevated recession risk in several markets, sometimes with substantial lead time, but the relationship is not deterministic and the relevant curve segment, policy regime, and term premium matter. Banks use inversion as one signal among others rather than a mechanical recession clock. Federal Funds Rate expectations embedded in futures markets indicate anticipated policy trajectories, letting banks read the market's policy forecast directly rather than constructing their own from scratch. Credit spreads between corporate and government bond yields indicate market risk appetite, with widening spreads signaling increased caution that may presage economic weakness — and repricing the bank's own bond portfolio in the process. Historically, spreads such as LIBOR-OIS were closely watched indicators of unsecured bank-funding stress, and their behaviour during 2007–08 became an important crisis signal. LIBOR has now fully ceased, so modern funding-stress monitoring uses the market indicators relevant to the current currency and institutional framework — which can include secured and unsecured money-market rates, term funding spreads, bank bond and CDS spreads, repo conditions, central-bank facility use, and other measures. There is no single one-for-one 'successor spread' that universally replaces LIBOR-OIS across all markets. Swap rates reflect market expectations of future interest rates across multiple horizons. Banks monitor these indicators to position their asset-liability management, adjust duration exposures, and anticipate funding cost changes.
The professional caveat cuts both ways: market indicators embed expectations that can be wrong, and they measure price, which includes risk appetite and liquidity alongside forecasts. The yield curve's inversion record is strong but not perfect, and structural changes — large central bank balance sheets compressing term premiums — have complicated its interpretation since 2008. Market signals are the fastest layer of the dashboard, not the most reliable one; the synthesis rule applies here most of all.
10. Real Estate: The Indicator Set Closest to the Loan Book
Real estate indicators carry particular significance for banking given the sector's outsized role in bank loan portfolios. Housing starts provide leading information about construction activity and related economic impacts on employment and materials demand. Home prices affect collateral values for mortgage portfolios and home equity lending, with price declines potentially triggering losses and reduced lending capacity — the 2008 crisis was, mechanically, a collateral-value collapse transmitted through exactly this channel. Mortgage delinquency rates provide early warning of consumer financial stress before it manifests in other loan categories, because households prioritize payments in a predictable hierarchy that makes mortgage stress a trailing confirmation and unsecured stress a leading one. Commercial real estate vacancy rates indicate health of office, retail, and industrial property markets that collateralize substantial commercial lending — a segment whose post-2020 structural shifts in office demand have kept CRE indicators at the top of risk-committee agendas. Real estate often represents thirty to fifty percent of total bank lending, making these indicators essential to portfolio risk assessment rather than a specialist's niche.
11. Currency and Trade Indicators: The External Layer
Currency and trade indicators inform banks with international exposures about external sector conditions. Exchange rate movements affect the domestic currency value of foreign currency assets and liabilities, translation risk for operations in multiple jurisdictions, and competitiveness of export-oriented borrowers. Current account balances indicate whether countries are net borrowers from or lenders to the rest of the world, with persistent deficits creating vulnerability to sudden stops in capital flows. Foreign reserve levels indicate capacity to defend currencies and maintain import capacity during external shocks — the adequacy metrics from the exchange rate chapter apply directly here. Trade deficits and surpluses indicate demand for trade finance services and the health of import-export oriented businesses that constitute important bank customer segments. For banks in open economies, the external layer is not an annex to the dashboard but a front-panel gauge: the 1997 Asian crisis arrived through the current account and reserve indicators long before it appeared in domestic GDP.
12. How Banks Operationalize the Dashboard
Banks employ economic indicators systematically across their operations to improve decision-making and risk management. Credit policy adjusts based on leading indicators, with deteriorating signals triggering tightened underwriting standards, reduced loan-to-value ratios, and increased collateral requirements before credit quality actually deteriorates. Provisioning policies build reserves when leading indicators turn negative, anticipating future losses rather than merely reacting to realized defaults — the forward-looking expected-credit-loss accounting frameworks adopted internationally since 2018 mandate exactly this, translating macro forecasts directly into balance-sheet reserves through formal models. Asset-liability management adjusts portfolio duration based on interest rate outlooks derived from yield curve analysis and policy expectations. Strategic planning uses economic forecasts to guide branch expansion, hiring decisions, and product launches toward markets with favorable prospects. Stress testing employs economic scenarios to model potential impacts of adverse conditions on portfolio performance and capital adequacy, satisfying regulatory requirements while informing risk appetite decisions.
A worked example compresses the flow. Suppose a bank's dashboard in successive quarters shows: PMI new orders falling from 54 to 47, the yield curve inverting, building permits down 15 percent year-on-year, while coincident indicators (payrolls, industrial production) still hold and lagging indicators (unemployment, NPA ratios) remain calm. The leading-heavy deterioration triggers the playbook: the credit committee caps new commercial real estate exposure and reduces maximum loan-to-value on new mortgages; the provisioning model's forward-looking overlays shift to a downside-weighted scenario, raising reserves before any loan has actually soured; ALM shortens bond portfolio duration in anticipation of eventual policy easing; stress tests rerun with a recession scenario as the base case. When the coincident indicators confirm the turn two quarters later and delinquencies begin rising, the bank experiences the downturn as a managed event rather than a surprise — the entire return on dashboard discipline realized in one sentence of the annual report: "provisions were raised early in anticipation of deteriorating conditions."
13. The Limits: False Signals, Revisions, and Broken Relationships
The art of economic indicator analysis lies not merely in monitoring individual data points but in synthesizing multiple indicators into coherent narratives about economic direction. No single indicator provides definitive guidance, and contradictions between different measures require careful interpretation. The relationship between indicators changes over time as economic structures evolve, requiring continuous model recalibration — the yield curve's information content shifts when central banks hold trillions in bonds; PMI survey responses behave differently in services-dominated economies than in manufacturing ones. External shocks can disrupt normal cyclical patterns, rendering historical relationships temporarily irrelevant: the pandemic produced the fastest GDP collapse and rebound on record, with every lag structure compressed beyond model specification.
Data revisions deserve particular professional respect. GDP undergoes revisions for years after first release; payroll employment is benchmark-revised annually; even inflation baskets reweight. Decisions made on first-release data are decisions made on drafts. The professional habits that follow: track the revision history of any series you rely on; prefer trends over point readings; weight indicators by their historical reliability for the specific decision at hand; and always know what data the consensus forecast already embodies, since only surprises move conditions. Banking professionals who master economic indicator analysis gain significant competitive advantage in anticipating changes that peers may miss, positioning their institutions to navigate cyclical fluctuations more successfully than less analytically sophisticated competitors — but mastery includes knowing when the dashboard is lying.
14. Common Misconceptions About Economic Indicators
"Leading indicators predict the future." They tilt probabilities, nothing more. Every leading series has issued false alarms; the yield curve, the best of them, has signaled recessions that structural change absorbed. Professional use means requiring cross-confirmation across independent indicators and sizing responses to confidence, not certainty.
"A rising unemployment rate means the economy is getting worse right now." Unemployment lags: it typically peaks after recovery has begun, because employers hire only when convinced. Rising unemployment alongside improving leading indicators is the normal signature of early recovery, not deepening recession.
"GDP is the scoreboard — watch it and you know everything." GDP is quarterly, revised for years, and silent about composition, distribution, and leverage. Two economies with identical GDP growth can present opposite banking environments depending on whether growth is credit-fueled or income-fueled, consumption-led or investment-led.
"The numbers are facts." They are estimates — surveyed, sampled, seasonally adjusted, and revised. The first GDP print and the final revision can differ enough to change the story. Treating releases as precise facts is the amateur's error; treating them as noisy signals with known error structure is the professional's method.
"Strong data is good for banks, weak data is bad." It depends on the reaction function. Strong data that forces aggressive tightening can hurt banks through bond losses and squeezed borrowers; weak data that triggers easing can steepen curves and restore margins. The banking impact runs through the policy and market response, not the data itself.
"More indicators mean better forecasts." Beyond a handful of well-chosen series, additional indicators add correlation, not information — most move together in clusters. Dashboard discipline means a small set of indicators with known lead times, tracked consistently, rather than a wall of charts reviewed sporadically.
15. Frequently Asked Questions
What are the three types of economic indicators? Leading indicators (PMI, yield curve, building permits) signal changes before they occur; coincident indicators (GDP, industrial production, payrolls) confirm current conditions; lagging indicators (unemployment rate, inflation, NPA ratios) validate trends after turns. The classification dictates use: leading for positioning, coincident for confirmation, lagging for provisioning and workout planning.
Which single indicator should a banker watch most closely? If forced to choose: the PMI new-orders component for the real economy and the yield curve for the policy/financial dimension. Both are leading, monthly-or-better, and historically reliable — but the honest professional answer remains that single-indicator surveillance is precisely what the synthesis discipline exists to prevent.
Why does the unemployment rate rise even after a recession ends? Because it is lagging: employers cut cautiously and rehire only when recovery seems durable, and re-entering job seekers can raise the measured rate even as employment grows. Post-recession unemployment peaks are normal arithmetic, not renewed deterioration.
How do banks use indicators in provisioning? Modern expected-credit-loss frameworks feed macro scenarios — GDP paths, unemployment projections, property price trajectories — directly into loss models, so deteriorating leading indicators raise reserves before defaults occur. The indicators are thus embedded in accounting, not merely commentary.
Why is an inverted yield curve taken so seriously? Because it has preceded most modern recessions by four to six quarters, and because the mechanism is logical: inversion means markets expect cuts, and cuts are the response to weakness. The caveat — structural distortions from large central bank balance sheets — is why professionals pair it with credit spreads and survey data before acting.
How does inflation data hit a bank differently from GDP data? Inflation primarily moves the policy rate path, hitting margins and bond values; GDP primarily moves borrower cash flows, hitting credit quality and loan demand. The stagflation case — weak GDP with high inflation — attacks both channels simultaneously, which is why it is banking's nightmare configuration.
Can banks forecast recessions reliably enough to act on? Not with precision — timing errors of two or three quarters are routine. But banking does not require point forecasts: it requires earlier optionality — tightening standards, building provisions, shortening duration — actions that pay off across a wide band of outcomes. The dashboard is for positioning, not prophecy.
16. Key Terms in This Chapter
- Leading indicator — a series that turns before the economy does (PMI, yield curve, permits).
- Coincident indicator — a series moving with the economy (GDP, industrial production, payrolls).
- Lagging indicator — a series confirming turns after the fact (unemployment rate, NPA ratios).
- GDP — total value of goods and services produced; the master coincident measure and recession arbiter.
- Core inflation — price measures excluding volatile food and energy, revealing underlying trends.
- Non-farm payrolls — the US monthly employment change; among the most market-moving releases.
- PMI — purchasing managers' survey index; above 50 expansion, below 50 contraction; new orders lead.
- Yield curve inversion — short rates above long rates; the classic recession warning.
- Credit spread — corporate over government yield gap; the market's risk-appetite gauge.
- Interbank funding spread — stress gauge for bank funding markets (LIBOR-OIS and successors).
- Countercyclical capital buffer — Basel III tool building capital in booms for release in busts.
- Procyclicality — banking's tendency to amplify cycles through collective lending swings.
- Expected credit loss — forward-looking provisioning translating macro forecasts into reserves.
- Vintage analysis — tracking loan performance by origination period; boom-year vintages default most.
- Data revision — the scheduled correction of initial estimates; first releases are drafts.
- Stress testing — scenario-based modeling of portfolio and capital resilience under adverse paths.
17. Interview Insights: How This Topic Appears in Banking Interviews
"Which economic indicators do you watch, and why?" Structure the answer by timing category with one strong example each — PMI new orders (leading), payrolls (coincident), NPA ratios (lagging) — then add the use-case layer: leading indicators drive credit policy, coincident confirm, lagging guide provisioning. Naming the decision each indicator informs demonstrates you understand the dashboard as an operating system, not a trivia list.
"How would you know a recession is coming?" No single signal — describe the confirmation cascade: yield curve inversion and credit-spread widening (market layer), PMI and permits rolling over (survey/activity layer), then coincident softening. Acknowledge false-signal history and lead times, and state the banker's response: tighten standards and build provisions early, accepting the cost of occasional false alarms against the cost of being surprised.
"Why do banks amplify business cycles?" Explain procyclicality as rational individual behavior producing collectively destructive outcomes: booms lower perceived risk and raise collateral values, expanding credit; busts force simultaneous tightening that deepens contraction. Close with the regulatory response — countercyclical buffers and forward-looking provisioning — and the institutional lesson that the dashboard exists partly to override competitive instinct at the peak.
"Strong jobs report — good or bad for banks?" The discriminating answer is "it depends on the reaction function": strong data supports credit quality and loan demand but may force tightening that hits bond portfolios and rate-sensitive borrowers. Walking both channels — and concluding that composition and starting conditions decide — shows macro judgment rather than headline reaction.
"How do indicators flow into provisioning?" Describe expected-credit-loss mechanics: macro scenarios feed probability-of-default and loss-given-default models, shifting reserves before defaults materialize. Mentioning that this framework exists precisely to break the old incurred-loss procyclicality connects accounting, regulation, and cycle theory in one answer.
Summary and Key Takeaways
- Economic indicators are production inputs for banks, not background reading — credit policy, provisioning, ALM, and strategy all run off the dashboard.
- The timing taxonomy governs use: leading indicators for positioning, coincident for confirmation, lagging for provisioning — and the dashboard is contradictory by design, demanding synthesis.
- GDP is the master coincident indicator; inflation drives the policy path; employment predicts consumer credit performance; PMI new orders lead the real economy.
- Market-based indicators — yield curve, credit spreads, funding spreads — are the fastest layer and embed expectations that can themselves be wrong.
- The business cycle maps directly to bank P&L, and procyclicality — banks collectively amplifying booms and busts — is the systemic failure mode regulators attack with countercyclical buffers and forward-looking provisioning.
- Real estate and external-sector indicators sit closest to the loan book: collateral values and current-account financing are where indicator risk becomes credit loss.
- Banks operationalize indicators through credit standards, expected-credit-loss provisioning, duration management, and stress testing — the playbook converts early signals into earlier optionality.
- Indicators are estimates: revised, noisy, and periodically decoupled by structural change — the professional edge lies in synthesis and knowing when the dashboard is lying.
Next: Topic 67 — How Money Moves Between Banks →
<!-- MBA-DEEP-DIVE-START -->Deep Dive: Turning Economic Data Into Bank Decisions
Economic indicators become valuable only when they change a decision. A bank can produce a beautiful macro dashboard and still manage risk badly if no one knows which metric changes underwriting, pricing, provisioning, liquidity, or strategy. The practical discipline is therefore to connect every indicator to a decision owner, portfolio, threshold, time horizon, and action.
The central question is not simply whether GDP, inflation, or unemployment moved. It is: what does the move imply for the bank's borrowers, deposits, funding, collateral, and capital, and how confident are we that the signal is real?
Start with the portfolio, not the national headline
A national economy can grow while a bank's portfolio deteriorates. A technology-heavy lender may face layoffs during otherwise strong GDP growth. An agricultural bank can struggle during a weather shock while urban services expand. A regional mortgage lender can suffer from local property weakness that never appears clearly in national housing data.
Macro analysis should therefore move from broad to specific:
- national activity and inflation;
- sector and regional indicators;
- borrower or customer-specific data;
- internal bank behaviour such as utilisation, arrears, deposits, and payment flows.
The internal data often turns first because the bank sees real customer behaviour before statistical agencies publish aggregate outcomes.
Internal transaction data can be a high-frequency economic indicator
Banks observe payroll credits, card spending, merchant receipts, corporate account turnover, tax payments, cash withdrawals, loan utilisation, and deposit movements daily.
Aggregated carefully and lawfully, these data can provide a near-real-time view of economic conditions. Falling payroll credits in one region can signal job losses. Declining merchant turnover can reveal weakening consumer demand. Rising overdraft utilisation can indicate corporate liquidity stress.
The advantage is speed. The risk is bias. A bank's customers are not the whole economy, and product or channel changes can distort the series. A new cashback campaign can increase card spending without any change in national consumption.
Internal indicators therefore need stable definitions, seasonal adjustment where appropriate, sample controls, and comparison with external data.
Vintage analysis links macro conditions to actual credit outcomes
A bank does not lend to an abstract economy; it lends cohorts of customers under different underwriting standards and market conditions.
Suppose mortgage vintages originated in 2024 show 0.5% serious delinquency after twelve months, while 2025 vintages reach 0.5% after only six months. National unemployment is still low.
The bank should investigate before waiting for macro confirmation. Perhaps house prices weakened in the regions where the 2025 book grew. Perhaps underwriting loosened. Perhaps borrowers took larger debt relative to income.
The best macro framework therefore combines external indicators with vintage and cohort behaviour. If both point in the same direction, confidence in the signal increases.
Credit utilisation can turn before default
Corporate borrowers often draw revolving facilities when internal cash becomes tight or market funding becomes difficult.
A sudden increase in utilisation across many customers can be an early sign of stress even while every borrower remains current. The same pattern appeared during major crisis periods when companies drew committed bank lines to secure liquidity.
Risk teams should distinguish normal seasonal utilisation from broad defensive drawdown. Relevant signals include:
- percentage of committed lines drawn;
- speed of utilisation increase;
- number of customers drawing simultaneously;
- sector concentration;
- deposit outflows from the same customers;
- requests for extensions or covenant relief.
This connects macro conditions directly to bank liquidity as well as credit risk.
Deposit flows reveal both confidence and interest-rate competition
Deposit data can be an economic indicator in its own right.
Households building savings can signal caution or strong income. Households drawing down balances can signal spending recovery or financial stress. Corporate deposit outflows may reflect tax dates, acquisitions, working-capital needs, higher-yield alternatives, or declining confidence in the bank.
The interpretation requires context.
A bank should therefore segment flows by customer type, product, insurance status, rate sensitivity, and transaction purpose rather than viewing total deposits as one macro series.
Property indicators need a financing lens
House-price indices are useful, but banks should also monitor transaction volumes, time on market, rental yields, vacancy, construction starts, inventory of unsold homes, mortgage approvals, affordability, and refinancing activity.
Price indices can remain stable while market liquidity collapses. If few transactions occur, published prices may lag reality.
For collateral risk, the question is not only 'What is the index level?' but what price could this property realise under stressed sale conditions and how long would the sale take?
Commercial real estate needs its own indicators: occupancy, rent collection, lease expiries, capitalisation rates, development pipeline, tenant concentration, and refinancing maturity.
Sector indicators can outperform GDP for corporate credit
A shipping lender may care more about freight rates than national GDP. An airline lender tracks passenger traffic, fuel, and load factors. A steel lender watches capacity utilisation, input costs, and benchmark steel prices. A semiconductor lender follows inventory and order cycles.
Portfolio managers should identify the two or three external variables most closely linked to each major sector's cash flow and monitor them consistently.
A generic macro dashboard with twenty national indicators can be less useful than one well-chosen sector metric with a clear link to debt service.
Inflation should be decomposed into borrower-specific pressure
Headline inflation can rise because of food, fuel, rent, wages, taxes, or imported goods. Those components affect borrowers differently.
For household credit, essential-cost inflation reduces disposable income even when wages are unchanged. For companies, the key issue is pass-through: can the borrower raise selling prices quickly enough to protect margin?
A bank can create sector inflation maps showing input exposure, contract repricing frequency, customer price sensitivity, and hedge coverage. This produces better credit insight than applying one CPI shock to every borrower.
Employment quality matters as much as the unemployment rate
A stable unemployment rate can hide changes in hours worked, wage growth, temporary employment, labour-force participation, or sector composition.
For retail lending, a borrower moving from stable salaried employment to irregular gig income can become more vulnerable even if aggregate unemployment is unchanged.
Banks should therefore use employment data alongside internal payroll history and income volatility where permitted. The macro series identifies the environment; customer data identifies the actual capacity to pay.
Business surveys are most useful as direction-of-travel indicators
PMIs, confidence surveys, and order books are valuable because they arrive quickly and often lead official output data.
Their weakness is that survey respondents report direction or sentiment rather than complete audited economic activity. A reading can improve because conditions became 'less bad' rather than genuinely strong.
Bankers should therefore focus on momentum and breadth. Is the index improving for three months? Are new orders, employment, and output all moving together? Is the improvement visible across sectors?
One noisy monthly print should rarely trigger a major credit-policy change on its own.
Market prices contain information but also technical noise
Bond yields, credit spreads, equity prices, CDS, FX, and commodities react continuously to information. They are powerful leading signals but can move because of positioning, liquidity, forced selling, or global risk appetite rather than domestic fundamentals.
A widening corporate credit spread can indicate worsening default expectations. It can also reflect a market-wide liquidity shock.
Risk teams should ask whether the move is issuer-specific, sector-wide, or system-wide. That classification changes the appropriate response.
Data revisions should be part of model governance
Many official indicators are revised after initial publication. A model trained on final revised data can appear more predictive than a decision process that only had the first release available at the time.
This is a subtle but important model-risk issue called look-ahead bias.
If a bank wants to test how well an indicator would have predicted past defaults, it should ideally use the vintage of data actually available on each historical decision date rather than the final revised series.
Otherwise the back-test gives the model information that real bankers never possessed.
Seasonal adjustment can create false comfort
Retail sales, employment, production, and many other indicators have strong seasonal patterns. Statistical agencies adjust for them, but unusual events — pandemics, strikes, tax changes, festivals, extreme weather — can make standard seasonal factors unreliable.
Banks should inspect both adjusted and unadjusted context where a large surprise seems economically strange.
Internal bank data has the same problem. Card spending around festivals, salary dates, school fees, and tax deadlines can produce large recurring patterns that need careful treatment before being labelled economic acceleration or stress.
Nowcasting fills the gap before official GDP
Quarterly GDP is too slow for daily bank management. Nowcasting uses higher-frequency data to estimate current economic activity before the official release.
Inputs can include surveys, production, employment, payments, mobility, trade, tax, and financial-market data.
The purpose is not to create false precision. A nowcast is a continuously updated estimate with uncertainty around it.
Banks can use nowcasts in planning and risk committees, but major decisions should consider ranges and alternative scenarios rather than one exact predicted GDP number.
Macroeconomic scenarios must be internally consistent
Stress testing often requires paths for GDP, unemployment, inflation, interest rates, property prices, FX, and other variables.
These variables cannot be chosen independently.
A severe recession with falling inflation may imply one interest-rate path. A supply-shock recession with high inflation may imply another. A currency crisis can combine weak growth, high inflation, higher rates, and depreciation.
An internally inconsistent scenario can produce misleading credit losses because models receive combinations that do not represent a plausible economic state.
Scenario governance should document the economic narrative connecting the variables.
Stress severity is not the same as forecast probability
A bank may have a base case it believes is most likely and a severe stress case it considers unlikely but possible.
The purpose of stress testing is not to predict the next recession exactly. It is to answer whether capital, liquidity, and critical services survive an adverse environment.
Management should therefore avoid weakening stress scenarios because they seem 'too pessimistic'. The question is whether the scenario is coherent and severe enough to test the vulnerability being studied.
Provisioning and accounting scenarios, by contrast, may use probability-weighted expectations under the applicable framework. The same macro variables can therefore serve different purposes with different probability treatment.
Early-warning thresholds need action, not just colour coding
A dashboard with red, amber, and green indicators has little value unless each status connects to a governance response.
For example:
- mortgage approvals down sharply → review growth assumptions and property stress;
- corporate utilisation rising → increase liquidity and credit monitoring;
- sector PMI below threshold for several months → tighten sector appetite or increase review frequency;
- unemployment rising → refresh retail affordability and ECL assumptions;
- credit spreads widening rapidly → review market and counterparty limits.
The action can be 'investigate', not always 'stop lending'. The objective is earlier attention and evidence-based escalation.
Indicators can conflict, and the conflict is information
Imagine consumer spending remains strong while manufacturing PMI contracts, unemployment stays low, and the yield curve is inverted.
There is no rule requiring one indicator to be declared correct.
The economy may be experiencing sector rotation. Households can remain resilient while manufacturing weakens. Labour markets can lag. Financial markets can anticipate future tightening effects.
A professional dashboard preserves the disagreement and asks which portfolio is exposed to which part of the economy.
A bank with industrial lending may already need caution while a payments franchise serving consumers remains strong.
A complete decision example
A bank enters the year with strong loan growth and low arrears. National GDP is still expanding at 3%.
Over three months, manufacturing new orders fall, corporate bond spreads widen, and the bank's own working-capital utilisation rises in industrial clients. Property transaction volumes decline, although house-price indices remain stable. Unemployment has not yet moved.
The bank does not declare a recession. It changes the questions it asks.
Credit committees increase scrutiny of leveraged industrial borrowers. New commercial-property loans use more conservative valuations. Treasury models larger committed-line drawdowns. Finance increases the probability weight on a downside scenario for expected-loss calculations where appropriate. Relationship managers contact clients with rapidly rising utilisation.
Six months later GDP slows and unemployment rises.
The bank's advantage was not that it predicted the exact date. It used several independent leading signals to create earlier optionality — more time to protect capital and support customers before stress became obvious.
What excellence looks like
A world-class bank turns economic indicators into a governed decision system. It combines national, regional, sector, market, and internal transaction data. It understands revisions and avoids look-ahead bias. Indicators are mapped to portfolios and actions. Scenarios are economically coherent. Stress testing is separated from forecasting. Early-warning signals trigger investigation before delinquency. Dashboards preserve disagreement rather than forcing one narrative.
The deepest lesson is that economic indicators are not a crystal ball. Their value comes from reducing decision delay. A bank that acts only after defaults rise has learned nothing from the macroeconomy. A bank that treats every leading signal as certainty will overreact. Excellence lies between them: use noisy information to ask better questions early, while keeping enough discipline to change course when the evidence changes.
<!-- MBA-DEEP-DIVE-END -->