Visual overview
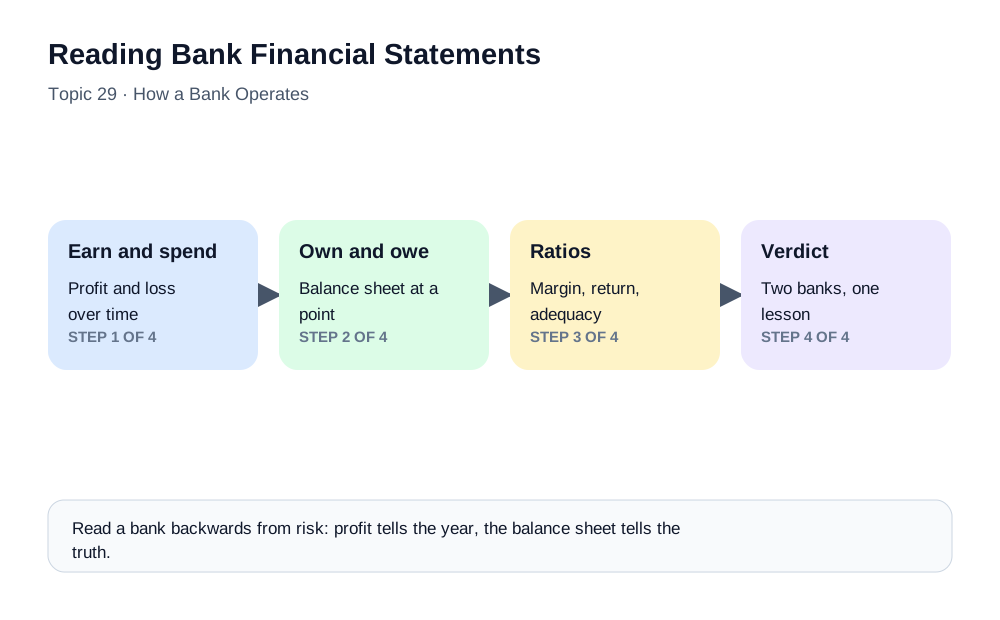
Reading Bank Financial Statements at a glance — Balance sheet, P&L, key ratios.
1. Introduction: The X-Ray of a Bank
Bank financial statements tell the story of how a bank earns money, manages risk, and builds strength. Unlike manufacturing companies, a bank's raw materials are money and trust. Learning to read bank financials is a skill that reveals the true health of any banking institution.
Investors analyze banks. Regulators supervise them. Job candidates interview with them. Customers entrust them with savings. Yet the bank itself — its real condition, not its marketing — lives in three documents: the income statement, the balance sheet, and the ratios computed from them. The good news is that bank financial statements, once you learn their distinctive grammar, are more revealing than those of almost any other industry, because a bank's business is conducted almost entirely in numbers. There is no brand value to guess at, no inventory to tour, no factory to inspect. The statements are the business.
This chapter teaches that grammar. We follow the money through a bank's profit and loss statement line by line, read the balance sheet the way an analyst does, master the ratios that compress a bank's health into comparable numbers, and finish with the warning signs that experienced readers spot before trouble becomes headline news.
Learning objectives. By the end of this chapter you should be able to:
- Explain the unique structure of a bank income statement, from net interest income to net profit
- Work with the core revenue arithmetic: interest earned, interest paid, and the margin between
- Read a bank balance sheet's assets, liabilities, and equity with an analyst's eye
- Compute and interpret the key ratios for profitability, asset quality, and capital strength
- Recognize the warning signs that precede visible deterioration
- Explain why bank statements differ from industrial companies' and what that means for analysis
2. The Income Statement (Profit & Loss)
A bank's P&L has a unique structure compared to other businesses. An industrial company reports revenue from selling goods, minus the cost of making them. A bank reports something stranger: the spread between what its money earns and what its money costs, plus fees, minus the losses it expects on its loans, minus the cost of running the institution. Each layer reveals a different management skill.
Net Interest Income (NII)
The most important line item for most banks:
- Interest earned — From loans, investments, and bonds
- Interest paid — To depositors and bondholders
- NII = Interest Earned − Interest Paid
A bank with $100B in loans earning 8% and $80B in deposits paying 4% earns:
- Interest income: $8B
- Interest expense: $3.2B
- NII: $4.8B
NII is the engine room. It reflects two capabilities at once: the pricing power of the bank's lending franchise (how much it earns on assets) and the cheapness of its funding (how little it pays for deposits). A bank with a loyal base of low-cost current and savings accounts — the fabled CASA deposit base — enjoys a structural funding advantage that flows straight into NII, which is why analysts obsess over deposit mix almost as much as loan growth.
Watch also how NII responds to interest-rate cycles. When central bank rates rise, banks with floating-rate loans and sticky deposit rates see NII expand; banks locked into fixed-rate assets with rate-sensitive funding see it squeeze. The same bank can report rising or falling NII purely because of where it stands in the rate cycle — which is why seasoned readers ask not just "how big is NII?" but "how does it behave when rates move?"
Non-Interest Income
Revenue from fees and services:
- Transaction and account fees
- Wealth management fees
- Trading income
- Insurance commissions
- Foreign exchange gains
Non-interest income is the diversifier. Fee businesses — payments, cards, wealth management, distribution commissions — earn without consuming balance sheet, which makes them capital-light and (mostly) credit-risk-free. But not all non-interest income is equal in quality. Recurring fee streams from sticky customer relationships are gold; trading income is volatile and can reverse; one-off gains on asset sales flatter a single year and should be stripped out by any careful reader. The trend matters as much as the level: a bank steadily growing fee income is building earnings that survive credit cycles.
Provisions for Loan Losses
Money set aside for loans expected to go bad:
- A major swing factor in bank profitability
- During recessions, provisions spike and can wipe out profits
- During good times, provisions may be reversed, boosting profits
This line is where banking's optimism meets accounting's realism. Every loan on the balance sheet is recorded at what the borrower promised to pay; provisions record what the bank expects not to collect. The charge runs through the P&L, directly reducing profit — which makes provisions the most judgment-laden number in the entire statement.
That judgment cuts both ways. Aggressive under-provisioning inflates today's profit and borrows from tomorrow's; conservative over-provisioning hides earnings in reserves (regulators actively police both). Modern expected-credit-loss standards, examined in Topic 30, force banks to provision for losses anticipated over a loan's life, not merely defaults already visible — pulling bad news forward into the accounts. When you read a bank's profit, always ask: how much of it survived the provisioning line honestly?
Operating Expenses
- Employee compensation (typically 40-50% of operating costs)
- Technology and infrastructure
- Rent and branch operations
- Regulatory and compliance costs
A useful habit is to pair the expense line with the income lines: costs mean nothing alone. A bank spending heavily on technology while income grows faster is investing; one whose costs grow faster than income year after year is drifting. The cost-to-income ratio, introduced below, exists precisely to make this comparison mechanical — but the narrative behind it (what is being spent, on what, with what return) is what separates a turnaround story from a technology black hole.
Banks are people-plus-technology businesses, and the expense line shows it. The strategic story to read here is the direction of spending: branches shrinking as digital channels grow, technology spending rising even where total costs are disciplined, and compliance costs — a permanent, post-2008 layer of the cost base — that no efficiency program can repeal.
The Bottom Line
Net Profit = NII + Non-Interest Income − Provisions − Operating Expenses − Taxes
The formula is worth memorizing not as arithmetic but as a sequence of questions: Is the core engine earning? Are fees diversifying it? What did credit cost? What does the machine cost to run? A bank's management earns its reputation on which of these five levers it can control when the others turn hostile.
3. The Balance Sheet
Topic 26 established the balance sheet's structure and its inversion relative to industrial companies; here we read it for meaning. The key is to see it not as a list but as a strategy made visible: every line expresses a choice about risk, liquidity, and return.
Assets (Ordered by Liquidity)
| Category | Typical % | Description |
|---|---|---|
| Cash & reserves | 5-10% | Vault cash + central bank deposits |
| Government securities | 15-25% | Statutory liquidity requirement |
| Loans & advances | 55-70% | The main earning asset |
| Fixed assets | 1-3% | Branches, ATMs, technology |
| Other assets | 3-5% | Accrued income, tax assets |
Read top to bottom, you are reading from safety to risk, and from low yield to high. Cash and central bank reserves earn least but answer every emergency; government securities earn modestly while satisfying statutory liquidity requirements and providing collateral; loans earn most and can neither be sold quickly nor trusted fully. The mix is the bank's personality: a conservative institution sits heavy in securities; an aggressive one pushes loans toward the top of the typical range — earning more in fair weather and falling harder in foul.
One modern caution: the "safe" government securities line is only as safe as its interest-rate exposure. The 2023 bank failures in the United States were not credit stories — the bonds were government-guaranteed — but duration stories: long-dated securities bought at low rates lost enormous market value as rates rose, and the losses were hiding in plain sight on the balance sheet for anyone who read the disclosures.
Liabilities
| Category | Typical % | Description |
|---|---|---|
| Customer deposits | 65-80% | CASA + term deposits |
| Borrowings | 10-20% | Interbank, bonds, central bank |
| Other liabilities | 3-5% | Payables, provisions |
The liability side is where bank analysis must start, because it determines how the bank dies if it dies. Two qualities matter: stickiness (will this funding stay in a panic?) and cost. Insured retail deposits in small accounts are the stickiest funding in finance; large uninsured deposits and wholesale borrowings are the flightiest — the 2023 failures were, on the liability side, stories of concentrated uninsured depositors who could and did leave within hours. A bank funding 80% of its balance sheet with granular insured deposits and one funding half with wholesale money may have identical balance sheet totals and utterly different survival prospects.
Equity
| Category | Description |
|---|---|
| Share capital | Paid-up capital from shareholders |
| Reserves | Statutory, general, and revaluation reserves |
| Retained earnings | Accumulated profits not distributed |
Two components deserve a word. Retained earnings is where profit goes when it is not paid out as dividends — the bank's organic capital factory, and the reason dividend policy is a prudential issue: a bank paying out most of its profit while growing its balance sheet is thinning its own cushion. Statutory and regulatory reserves are amounts set aside under law or regulation for defined purposes — including, in some jurisdictions, general reserves against future loan losses that sit in equity precisely because they are not earmarked for specific bad loans. Equity is the shock absorber — the money that belongs to the owners and therefore stands first in line to absorb losses before depositors are touched. In banking, equity is both small (single digits as a share of assets) and sacred: regulators set minimum capital precisely because it is the only layer of the balance sheet whose losses hurt no outsider. When you read that a bank "grew its balance sheet 20%," the first question is always: did capital keep pace, or did the cushion just get thinner?
4. Key Financial Ratios
Ratios compress the statements into comparable form — comparable across banks of different sizes, and across time for the same bank. Three families cover most of what matters.
Profitability
| Ratio | Formula | Good Range |
|---|---|---|
| Return on Assets (ROA) | Net Profit / Total Assets | 1.0-1.5% |
| Return on Equity (ROE) | Net Profit / Equity | 12-18% |
| Net Interest Margin (NIM) | NII / Average Earning Assets | 2.5-3.5% |
| Cost-to-Income | Operating Expenses / Total Income | 40-55% |
A caveat before the chain: ratios compare meaningfully only against like institutions. A retail universal bank, a wholesale lender, a payments-led institution, and a development bank have structurally different NIMs, cost ratios, and capital profiles. The "good ranges" in these tables are guideposts for a typical commercial bank, not laws — the correct comparison is always against close peers and the bank's own history.
These four form a diagnostic chain. ROA is the honest measure of how hard the whole balance sheet works — and it is structurally low in banking (1–1.5% would embarrass a software company and delight a bank) because the balance sheet is enormous relative to the margin it earns. ROE is ROA multiplied by leverage: with equity at perhaps 8% of assets, a 1.2% ROA mechanically becomes a mid-teens ROE. This is why bank ROE must never be compared across leverage levels — a bank can raise ROE by improving performance or by shrinking its capital cushion, and the two have opposite implications for safety.
NIM isolates the core spread business from fees and one-offs, making it the cleanest read on franchise quality; a structurally declining NIM signals competition eroding pricing power faster than costs can adjust. Cost-to-income measures operational efficiency — how many cents of each revenue dollar the machine consumes — and its trend tells you whether growth is being converted into profit or eaten by the cost base.
Asset Quality
| Ratio | Formula | Good Range |
|---|---|---|
| Gross NPA Ratio | Gross NPAs / Gross Loans | < 3% |
| Net NPA Ratio | Net NPAs / Net Loans | < 1% |
| Provision Coverage | Provisions / Gross NPAs | > 70% |
Non-performing assets (NPAs) — loans whose borrowers have stopped paying — are banking's bad news made countable. The three ratios must be read together, because each defeats a different evasion. Gross NPA measures how much of the book has soured. Net NPA subtracts provisions already taken, showing the unprovided residue still hanging over future profits. Provision coverage measures how honestly the first number has been faced.
The classic warning pattern: a bank reporting moderate gross NPAs but falling provision coverage is choosing reported profit today over honesty about tomorrow. The reverse — rising coverage even as NPAs grow — is painful but healthy: bad news arriving early, which is exactly what expected-loss accounting (Topic 30) is designed to force.
Capital Strength
| Ratio | Formula | Minimum |
|---|---|---|
| Capital Adequacy (CAR) | Capital / Risk-Weighted Assets | 10.5% (Basel III) |
| Tier 1 Ratio | Tier 1 Capital / RWA | 8.5% |
| Leverage Ratio | Tier 1 Capital / Total Exposure | 3% |
Capital ratios answer the ultimate question: how much loss can this bank absorb before outsiders are hurt? The denominators differ meaningfully. Risk-weighted assets adjust for riskiness — government bonds count for little, unsecured corporate loans for much — so CAR rewards safer asset mixes. The leverage ratio uses raw exposure with no risk adjustment, deliberately crude, as a backstop against gaming the risk weights. A bank strong on one and thin on the other is telling you something about how it achieved the strong number.
Above the minimums, watch the buffer: a bank operating at 11% against a 10.5% requirement has almost no room for bad luck or growth; well-run banks hold management buffers of several points above the floor, and markets punish those that let the margin thin.
5. Reading Between the Lines
Watch for these warning signs:
- Rising NPAs with falling provision coverage
- Declining NIM suggesting competitive pressure or poor asset-liability management
- High cost-to-income ratio indicating operational inefficiency
- Capital ratios close to regulatory minimums
To these, experienced analysts add a second layer — the signals that rarely appear in headline ratios:
Loan growth far above system growth. Lending is the one product a bank can always sell more of by lowering standards. A bank growing loans at twice its peers' rate is either brilliantly positioned or quietly buying tomorrow's NPAs; the answer emerges in the asset-quality ratios two to three years later.
Deposit franchise erosion. Falling CASA share, rising reliance on bulk and wholesale deposits, lengthening lists of "other borrowings" — funding deterioration shows up on the liability side long before the failure it can cause.
Rising "other income" dependence. When fee and trading income props up profits while NII stagnates, check whether the core franchise is actually healthy.
Disclosure drift. Changes in accounting policies, auditor qualifications, lengthening "contingent liabilities" notes, and management commentary that grows vaguer as numbers grow worse. The notes to the accounts are where banks confess what the headline numbers cannot say.
The divergence test. Perhaps the single most powerful habit: compare what management says with what the ratios do. Optimistic commentary alongside thinning capital, rising NPAs, and deteriorating funding is the oldest pre-failure pattern in banking — visible, in retrospect, in nearly every collapse.
6. A Worked Reading: Two Banks, One Lesson
Compress the chapter into a single exercise. Two banks report identical net profits of $1.2B. Which is healthier?
Bank A: ROA 1.4%, ROE 14%, NIM 3.2% and stable, cost-to-income 46%, gross NPA 1.8% with 78% provision coverage, CAR 15%, deposits 82% of funding with a strong CASA base, loan growth in line with the system.
Bank B: ROA 0.9%, ROE 15%, NIM 2.4% and falling, cost-to-income 58%, gross NPA 3.9% with 55% coverage and falling, CAR 11.2% against a 10.5% floor, wholesale funding near 30%, loans growing at twice the system rate.
Same profit, opposite prospects. Bank B's higher ROE is achieved on a thinner cushion (lower ROA, higher leverage); its asset quality is deteriorating and under-provisioned; its funding is flight-prone; its growth is the classic standards-loosening signature. Bank A's boring profile — wide margin, honest provisioning, fat capital buffer, sticky deposits — is what durable banking looks like. An investor, a regulator, a job candidate, and a large depositor would all reach the same conclusion from the same six lines, which is precisely why this skill is worth having.
7. Common Misconceptions About Bank Financial Statements
"A bank with big profits is a strong bank." Profit is the last indicator to deteriorate and the easiest to flatter — under-provisioned loans, one-off gains, and aggressive recognition can all inflate a single year. Strength lives in capital buffers, funding structure, and asset quality trends, not in any year's bottom line.
"Government bonds on the balance sheet are risk-free." They are default-risk-free, not price-risk-free. Long-dated bonds bought at low rates lose heavy market value when rates rise — the precise mechanism behind the 2023 US regional bank failures. "Safe" assets can still kill through the interest-rate channel.
"High ROE means a well-run bank." ROE is ROA multiplied by leverage; it rises when performance improves and when capital thins. Praising a bank's ROE without checking its capital adequacy is praising the tightrope walk without asking about the net.
"Rising loan growth is good news." Only if standards hold. Lending is the product banks can always sell more of by accepting worse risks; growth far above the system rate is the oldest leading indicator of future NPAs.
"Audited statements can't hide problems." Audit assures that statements follow accounting standards — it does not eliminate the judgment those standards permit, especially in provisioning and valuation. The 2008 crisis featured banks with clean audit opinions and worthless assets. Read the notes; audit is a floor, not a guarantee.
8. Who Reads Bank Statements — and What Each Looks For
The same statements serve four very different readers, and knowing their lenses sharpens your own.
Equity investors read for earnings power and its durability: NIM trajectory, PPOP, ROE against capital, and dividend capacity. They forgive a bad year if the franchise is intact; they flee a good year built on under-provisioning.
Regulators read for resilience: capital buffers, liquidity, concentration, and the honesty of asset classification. Their question is not "how much did it earn?" but "how much can it lose?" — which is why supervisory returns demand far more granular asset-quality data than public statements show.
Depositors and creditors — including the large corporate treasurers whose balances make or break funding — read for the ability to repay: funding stability, capital, and asset liquidity. They care nothing for ROE and everything for the cushion between them and loss.
Management itself reads for steering: which businesses earn their capital, where costs outrun income, which vintages of loans are souring. The public statements are the summary; the same logic, run at product and branch level, is how banks are actually run.
The analyst's craft is reading with all four lenses at once — because a bank that satisfies one audience while failing another is usually in the process of changing audiences involuntarily.
9. Frequently Asked Questions
Why are bank financial statements so different from other companies'? Because the business is inverted: money is both the raw material and the product. Deposits (other people's money) are the dominant liability; loans (promises) are the dominant asset; and the income statement reports a spread rather than sales minus cost of goods. Once the inversion is understood, bank statements are actually simpler than industrial ones — almost everything is already in financial terms.
What is the single most important number in a bank's P&L? Net interest income, for most banks — it is the recurring engine everything else modifies. But the most informative line is often provisions: it reveals both the true condition of the loan book and management's honesty about it.
What is a good NIM? Context-dependent — the 2.5–3.5% guidepost fits many markets, but retail-heavy banks in high-rate economies run wider, and wholesale banks in competitive markets run thinner. Trend and stability matter more than level: a bank holding a 3% NIM through a rate cycle demonstrates more franchise strength than one swinging between 2% and 4%.
What exactly is an NPA? A loan on which interest or principal is significantly overdue (the regulatory threshold is commonly 90 days) — at which point the bank must stop recognizing the unpaid interest as income and begin provisioning against the exposure. NPAs are the countable face of credit risk.
How do interest-rate changes show up in the statements? Through two doors. First, the P&L: as loans and deposits reprice, NII expands or compresses over the following quarters — visible in the NIM trend. Second, the balance sheet: fixed-rate securities fall in market value as rates rise; depending on their accounting classification (Topic 30), those losses hit equity immediately or lurk in the notes as unrealized losses. The 2023 failures taught every analyst to check both doors, not just the first.
Why do banks report high ROE but low ROA? Leverage. With equity around 8% of assets, each dollar of profit per hundred of assets becomes roughly twelve dollars per hundred of equity. High ROE is arithmetic, not automatically excellence — which is why it must always be read beside capital ratios to see how thin the cushion generating it has become.
Are the "good ranges" in the ratio tables universal? No — they are guideposts for a typical commercial bank in a stable, mid-rate economy. Retail banks in high-rate markets run wider NIMs; wholesale and payments-led institutions run structurally different ratios entirely. Use ranges to orient, then judge against close peers and the bank's own five-year trend — context turns a number into a diagnosis.
What is provision coverage and why does it matter? Provisions held divided by gross NPAs — how much of the known bad news has already been charged against profit. High coverage means the P&L has absorbed the pain; low coverage means future profits still owe it. Falling coverage alongside rising NPAs is the classic profit-inflation pattern.
What is the difference between CAR and the leverage ratio? CAR divides capital by risk-weighted assets, so safer portfolios need less capital; the leverage ratio divides by raw exposure, ignoring risk weights entirely. The first is sensitive, the second is game-proof; regulators require both because each covers the other's blind spot.
What is pre-provision operating profit (PPOP)? Profit before the provision charge and tax — NII plus fees minus operating costs. Analysts use it as the cleanest measure of underlying earning power, because it strips out the provisioning cycle's swings. A bank can mask weak PPOP for a year or two with low provisions, but not indefinitely: eventually the loan book presents its bill.
Can a profitable bank still fail? Frequently — profit is backward-looking. A bank can report record earnings while its funding flees (liquidity failure), its bond portfolio sinks in value (rate failure), or its NPAs accumulate unprovided (credit failure arriving late). This is why the warning-signs section reads trends and structure, not just profit.
What is the first ratio to check if I can only check one? Capital adequacy with its buffer above the regulatory floor. It is the survival ratio: every other weakness — bad loans, margin squeeze, funding pressure — ultimately expresses itself as pressure on capital. A bank comfortably above its minimum can absorb almost any single shock; one hugging the floor is one bad quarter from a crisis, whatever its profit line says.
Where do I find the real story in a bank's annual report? In order: the notes on asset quality and provisions; the funding and liquidity disclosures; the capital ratio composition; the contingent liabilities; and the auditor's report. The glossy front section is marketing; the notes are the institution.
How often should a bank's ratios be monitored? Quarterly at minimum — banks publish quarterly results in most markets — because banking deterioration compounds: NPAs beget provisions beget capital erosion. The divergence between quarters, watched consistently, reveals far more than any single snapshot.
10. Key Terms in This Chapter
- Net interest income (NII) — interest earned minus interest paid; the core banking engine.
- Net interest margin (NIM) — NII as a percentage of average earning assets; franchise quality in one number.
- Non-interest income — fees, commissions, trading, and other non-spread revenue.
- Provisions — charges against profit for expected loan losses; banking's judgment line.
- NPA (non-performing asset) — a loan significantly overdue, typically 90+ days.
- Gross / Net NPA ratio — bad loans as a share of the book, before and after provisions.
- Provision coverage ratio — provisions as a share of gross NPAs; honesty about bad news.
- ROA / ROE — profit relative to assets / to equity; linked by leverage.
- Cost-to-income ratio — operating expenses as a share of total income; efficiency.
- CASA — current account and savings account deposits; cheap, sticky funding.
- CAR (capital adequacy ratio) — capital against risk-weighted assets; loss-absorption capacity.
- Tier 1 capital — the highest-quality capital: common equity and disclosed reserves.
- Risk-weighted assets (RWA) — assets scaled by regulatory riskiness, the denominator of capital ratios.
- Leverage ratio — capital against unweighted exposure; the crude backstop.
- Expected credit loss (ECL) — provisioning for anticipated, not merely incurred, losses (Topic 30).
- Pre-provision operating profit (PPOP) — earnings before provisions and tax; underlying earning power.
- Duration risk — the sensitivity of bond values to interest-rate changes; the 2023 failures' mechanism.
11. Interview Insights: How This Topic Appears in Banking Interviews
"Walk me through a bank's income statement." NII first (the spread engine and its rate sensitivity), then non-interest income (quality of fees over trading), then provisions (the judgment line where honesty lives or dies), then operating costs, to net profit. Close with the five-lever framing — the answer that shows structure, not memorization.
"How do you assess a bank's health in five minutes?" Six lines: NIM trend, gross and net NPA with coverage, CAR with its buffer, deposit share and CASA mix of funding, ROA (with ROE checked against leverage), and loan growth versus system. State explicitly that identical profits can hide opposite conditions — and if given time, narrate the two-bank comparison from Section 6.
"Why is ROE misleading for banks?" Because leverage manufactures it: ROE = ROA × (assets/equity). A bank can lift ROE by shrinking capital rather than improving performance — precisely the wrong direction for safety. Always read ROE beside CAR and ROA; that pairing is the mark of a candidate who has analyzed banks rather than companies.
"What early warning signs precede bank failures?" Funding deterioration first (deposit flight, wholesale dependence), then asset quality (NPAs up, coverage down), then capital thinning toward the floor — with management commentary growing optimistic as numbers worsen. The 2023 failures supply the modern variant: rate losses on "safe" securities plus concentrated uninsured deposits. Profit is the last thing to deteriorate; that is the trap.
"How do the three statements connect for a bank?" The P&L's net profit flows into equity on the balance sheet (through retained earnings); provisions raised in the P&L reduce loan values on the asset side; capital raised or dividends paid adjust equity and cash. The cash flow statement — less watched for banks than for companies, because a bank's "operations" are themselves financial flows — reconciles the movement in cash and reserves. The connection that matters most: every provision is simultaneously a P&L charge and a balance-sheet reserve, which is why provisioning policy is the single most powerful dial in bank accounting.
"What is the relationship between provisions and the credit cycle?" Provisions are countercyclical by nature and, under expected-loss accounting, by design: they spike in downturns (crushing profit exactly when the economy suffers) and thin in booms (flattering it). Sophisticated answer: this is why analysts look at pre-provision operating profit as the measure of underlying earning power — it strips out the cycle's loudest distortion.
Summary and Key Takeaways
Bank financial statements are the institution itself rendered in numbers — learn their grammar and no bank can bluff you. The essential points:
- The P&L is a five-lever machine: NII, fee income, provisions, costs, and tax — each a distinct management skill, each a distinct place for trouble to hide.
- NII is the engine, deposits the fuel: the spread business lives or dies on asset pricing and funding cost, which is why CASA franchises command premium valuations.
- Provisions are the honesty line: the most judgment-laden number in the statements, and the first place to look for profit inflation.
- The balance sheet is strategy made visible: asset mix reveals risk appetite; liability structure reveals how the bank dies if it dies; equity is the small, sacred cushion.
- ROA measures performance; ROE measures performance × leverage: never read one without the other, and never read either without capital ratios.
- Asset quality must be read as a trio: gross NPA, net NPA, and coverage together defeat the three classic evasions.
- Capital is the survival question: CAR and the leverage ratio, read for buffer above the floor, answer how much loss the bank can absorb.
- Warnings arrive before failures: funding erosion, rising NPAs with falling coverage, thinning capital, and divergent commentary precede nearly every collapse.
- Profit is backward-looking; structure is forward-looking: identical profits can conceal opposite futures — the analyst's job is reading the structure.
- Audit is a floor, not a guarantee: statements can follow every standard and still conceal judgment-driven fragility — the notes, trends, and funding structure are where careful readers actually live.
A final encouragement for the reader new to all this: the skill compounds. The first bank annual report you read slowly, checking every ratio against this chapter's tables, will take an evening. The tenth will take an hour, and you will catch yourself asking the questions before the numbers answer them — why is coverage falling, where is this growth coming from, who funds this balance sheet? That reflex, once installed, never leaves: you have learned to see banks the way regulators, investors, and bankers themselves do.
In the next topic, we go one level deeper into how these numbers are made — bank accounting standards: the rules governing recognition, measurement, provisioning, and disclosure that determine what the statements are allowed to say.
Next: Topic 30 — Bank Accounting Standards →
<!-- MBA-DEEP-DIVE-START -->Deep Dive: Reading a Bank’s Financial Statements Like a Banker
Bank financial statements look familiar because they still contain a balance sheet, income statement, cash-flow statement, and notes. Yet the economics are very different from a manufacturing company. For a bank, financial assets and liabilities are not merely financing around the business — they are the business. Loans, securities, deposits, wholesale funding, derivatives, capital, and liquidity positions determine both earnings and survival.
The most useful way to analyse a bank is therefore to connect four questions:
- How does the bank fund itself?
- What assets does it hold and how risky are they?
- How much profit does it earn for the risk and capital used?
- How resilient would the balance sheet be if credit losses, funding costs, market rates, or liquidity conditions worsen?
A single ratio cannot answer all four.
Start with the balance sheet structure
A simplified bank balance sheet contains assets such as cash and central-bank balances, interbank placements, securities, customer loans, trading assets, derivatives, property, and other receivables. Liabilities include customer deposits, interbank borrowing, issued debt, derivatives, and other obligations. Equity absorbs residual losses.
The first analytical step is not to calculate ratios immediately. It is to understand composition.
A bank whose assets are mainly prime residential mortgages has a different risk profile from one concentrated in unsecured consumer credit, commercial real estate, leveraged corporate loans, or emerging-market sovereign debt. Two banks with identical total assets can therefore have very different credit, duration, liquidity, and concentration risk.
The same applies to funding. A bank funded mainly by granular insured retail deposits differs from one dependent on a few large corporate deposits or short-term wholesale markets.
Loans should be analysed by portfolio, not as one line
The gross loan balance is only the beginning. The notes should be examined for segmentation by product, geography, industry, borrower type, collateral, currency, and credit quality where disclosed.
Suppose Bank A and Bank B each have ₹1 lakh crore of loans.
Bank A holds mostly residential mortgages with conservative loan-to-value ratios across diversified regions.
Bank B holds a large concentration of commercial property development loans in one city.
The accounting total is the same. The economic risk is not.
A strong analyst looks for concentration before average quality. A portfolio can report low historical defaults and still be dangerous if one common shock can affect many borrowers together.
Gross loans, allowances, and net loans
Banks generally present loans gross of credit-loss allowances and then deduct allowances to arrive at a net carrying amount.
If gross loans are ₹100,000 crore and the loss allowance is ₹3,000 crore, net loans are approximately ₹97,000 crore, subject to the precise accounting presentation.
The allowance is not cash placed in a box. It is an accounting estimate of credit losses recognised against earnings and the asset carrying amount or through an allowance account.
A rising allowance can mean several things: asset quality worsened, the economic outlook weakened, the portfolio grew, models changed, or management became more conservative. The analyst must read the movement, not just the ending number.
Non-performing or impaired exposures
Regulatory and accounting definitions of non-performing, defaulted, or credit-impaired assets are not always identical, but the analytical question is similar: how much of the loan book has experienced serious deterioration?
Useful measures include gross impaired or non-performing exposures, net impaired exposures after allowances, coverage ratios, write-offs, recoveries, restructurings, and delinquency buckets.
A low reported non-performing ratio is encouraging only if recognition is timely. Repeated restructuring, evergreening, unusually low write-offs, or rapid loan growth can mask emerging stress.
Trend analysis is therefore essential. One year can be misleading.
Provision coverage requires context
A simple coverage ratio compares allowances with impaired or non-performing exposures. Higher coverage can indicate a stronger loss buffer, but it should not be interpreted mechanically.
Secured mortgage portfolios may require lower loss severity because collateral recovery is stronger. Unsecured consumer credit may need higher expected loss. A bank with older heavily provisioned bad loans may show high coverage, while a newer stress cycle has not yet matured.
The quality of collateral, legal recovery process, loan seniority, guarantees, and macroeconomic environment all affect expected recovery.
Net interest income and net interest margin
For many banks, net interest income (NII) is a core revenue source: interest earned on loans and securities minus interest paid on deposits and other funding.
The net interest margin (NIM) relates net interest income to an average earning-asset base, though exact definitions can vary by institution and jurisdiction.
NIM should be analysed as a result of several drivers:
- asset yield;
- deposit and wholesale funding cost;
- loan mix;
- deposit mix;
- central-bank policy rates;
- yield-curve shape;
- hedging;
- competition;
- non-performing assets that stop or reduce interest recognition.
A rising policy rate can initially increase NIM if variable-rate loans reprice faster than deposits. Later, customers may demand higher deposit rates and the margin can compress. The timing of repricing matters.
Deposit beta and funding cost
A useful concept is deposit beta: how much of a change in market rates passes through to deposit pricing.
Suppose policy rates rise by 200 basis points while the bank’s average deposit cost rises by 80 basis points. The implied beta over that period is 40%, using a simplified calculation.
Banks with strong transaction-account franchises may have lower deposit betas because customers value payments, convenience, and relationships, not only yield. Banks competing aggressively for rate-sensitive deposits may reprice faster.
The deposit franchise is therefore an economic asset even though internally generated customer relationships may not appear as a recognised accounting asset.
Non-interest income must be separated by quality
Fee and other income can include payments fees, card revenue, asset-management fees, brokerage, advisory fees, insurance distribution, trading income, FX income, gains on securities, and one-off items.
Recurring service fees are usually more predictable than gains from selling securities. Trading income can be strong but volatile. A large one-time disposal gain can inflate profit without improving the underlying franchise.
Analysts should therefore distinguish recurring operating revenue from episodic or market-dependent revenue.
Operating expenses and efficiency
Major bank costs include staff, branches, technology, premises, professional services, marketing, regulatory programmes, and depreciation.
The cost-to-income ratio compares operating expenses with operating income under the institution’s chosen definition. Lower is generally more efficient, but context matters.
A bank investing heavily in a core-system migration may temporarily report higher costs while building long-term efficiency. A very low cost ratio may reflect underinvestment in controls or technology. Digital banks can have lower branch costs but high technology and customer-acquisition expense.
Efficiency should be evaluated alongside service quality, operational resilience, and growth quality.
Pre-provision profit helps isolate the credit cycle
One useful analytical measure is profit before credit-loss provisions and sometimes before certain other items, depending on presentation. This shows the earning power of the franchise before current-period credit deterioration.
Imagine two banks each report ₹1,000 crore of net profit.
Bank A generates ₹5,000 crore of pre-provision operating profit and records ₹3,500 crore of credit provisions.
Bank B generates ₹2,000 crore of pre-provision profit and records only ₹500 crore of provisions.
Their final profit is similar, but the underlying stories differ. Bank A has strong earning capacity under heavy credit stress. Bank B has weaker pre-provision earnings but currently benign credit losses.
This distinction becomes valuable in downturns.
Return on assets and return on equity
Return on assets (ROA) measures profit relative to the asset base. Because banks are highly leveraged, small changes in ROA can be economically significant.
Return on equity (ROE) measures profit relative to shareholder equity.
A bank can increase ROE by earning more profit or by using less equity. The second route increases leverage and can reduce resilience. High ROE is therefore not automatically good if it is achieved through thin capital, concentrated risk, or under-provisioning.
A more complete question is: what return is being earned for the amount and type of risk taken?
Capital ratios are not the same as accounting equity ratios
Regulatory capital is calculated under prudential rules and differs from simple accounting equity. Common Equity Tier 1, Additional Tier 1, Tier 2, risk-weighted assets, deductions, buffers, and leverage ratios create a regulatory view of loss-absorbing capacity.
A bank can have ₹10,000 crore of accounting equity and a different amount of eligible regulatory capital after deductions and adjustments.
Risk-weighted asset density is also informative. If two banks have the same total assets but one has much higher RWA, its assets may carry greater regulatory risk weights because of their composition.
The risk-weighted capital ratio should therefore be read together with the leverage ratio, which constrains total exposure without relying solely on risk weights.
Liquidity is not visible from capital alone
A solvent bank can still fail if it cannot meet cash outflows. Financial-statement analysis should therefore examine cash and central-bank balances, liquid securities, deposit composition, wholesale funding maturities, encumbered assets, and disclosed prudential liquidity measures.
Large deposits from a small number of customers deserve special attention. A bank may report total deposits of ₹50,000 crore, but if ₹20,000 crore belongs to a small group of uninsured corporations that can transfer funds instantly, the liquidity risk differs from fifty lakh small household accounts.
The Silicon Valley Bank episode demonstrated how digital withdrawal speed and deposit concentration can matter even when traditional liquidity analysis seemed adequate under calmer assumptions.
Held-to-maturity does not mean economically risk-free
Banks may classify securities under accounting categories that affect whether fair-value changes pass through profit, equity, or are not recognised in the same way in current earnings. The exact categories depend on accounting standards and business model.
An important analytical lesson is that accounting classification does not remove economic interest-rate risk.
Suppose a bank holds a fixed-rate bond purchased at par. Market rates rise sharply and the bond’s fair value falls to 85. If the bank can hold the bond to maturity and the issuer repays, the interim market loss may not become a realised credit loss. But if the bank must sell the bond to meet deposit outflows, the economic loss becomes real.
The interaction between liquidity and fair value therefore matters as much as the accounting label.
Duration risk and equity sensitivity
Fixed-rate assets lose market value when rates rise. Long-duration assets are more sensitive.
Banks manage this through asset-liability management, hedging, deposit modelling, securities allocation, and capital planning. Financial statement notes may provide interest-rate sensitivity, duration metrics, or economic value analysis.
An analyst should ask whether the bank’s funding reprices faster than its assets, whether hedges are effective, and whether deposits assumed to be stable could leave during stress.
Derivatives: gross notional is not the same as credit exposure
Large banks can report enormous derivative notional amounts. Notional is the reference amount used to calculate payments; it is not automatically the amount at risk.
The relevant exposures depend on fair value, netting agreements, collateral, counterparty credit risk, future exposure, and the purpose of the derivative.
A bank may use interest-rate swaps to hedge mortgage duration. The gross notional can be huge while net economic risk is controlled. Conversely, a smaller notional in a concentrated uncollateralised counterparty exposure can be dangerous.
Notes on derivatives should therefore be read in context.
Off-balance-sheet exposures are still exposures
Banks provide undrawn loan commitments, letters of credit, guarantees, derivatives, and other contingent facilities. These may not appear as funded assets at inception, but they can become real cash obligations.
A corporate customer with a ₹1,000 crore committed revolving line may draw it during a market crisis precisely when the bank is also experiencing liquidity pressure.
Stress analysis should therefore include committed but undrawn facilities, not only funded loans.
Segment reporting reveals strategy
Where banks report business segments, the analyst can compare retail, corporate, wealth, markets, and other divisions by revenue, assets, profit, and capital.
Segment data can show whether group profit depends excessively on one volatile business. It can also reveal cross-subsidies: a payments business may appear low margin but generate deposits that benefit treasury and lending.
Allocation methods matter, especially funds transfer pricing and shared costs, so segment profitability should not be treated as perfectly objective.
Cash-flow statements require special interpretation for banks
In ordinary companies, operating cash flow is often a strong measure of business health. For banks, movements in customer deposits and loans can create enormous operating cash flows that are part of normal financial intermediation.
A rise in deposits can produce a large cash inflow even though deposits are liabilities that must eventually be repaid. A rise in lending can consume cash while increasing interest-earning assets.
The cash-flow statement remains useful but should not be analysed with the same intuition used for industrial companies.
Notes and accounting policies are essential
The most important risk information is often outside the primary statements. Notes can explain loan staging, ECL assumptions, collateral, concentration, restructured exposures, fair-value hierarchy, securities classification, derivatives, related parties, pension obligations, tax disputes, litigation, commitments, and regulatory capital.
Accounting policy changes can alter trends. A ratio that appears to improve may reflect a changed definition or portfolio reclassification.
Good analysis therefore compares definitions across periods before comparing numbers.
A practical analytical walkthrough
Imagine a bank reports the following broad changes over one year:
- loans grow 20%;
- deposits grow 8%;
- wholesale borrowing rises sharply;
- NIM improves;
- fee income is stable;
- non-performing loans remain flat as a percentage;
- credit-loss allowances rise 35%;
- ROE increases;
- regulatory capital ratio falls moderately;
- liquidity buffers decline.
A superficial reading says: strong growth, better margin, stable asset quality, higher shareholder return.
A deeper reading asks why lending is growing much faster than deposits. The bank is becoming more dependent on wholesale funding. The rising allowance suggests management or models see greater future credit risk despite stable current NPLs. Falling capital ratios mean growth is consuming capital. Lower liquidity buffers reduce flexibility. Higher ROE may partly result from more leverage.
The same numbers can therefore describe both growth and increasing fragility.
Peer comparison should control for business model
Comparing a private bank, cooperative bank, investment bank, housing lender, and consumer lender using the same target ratios can mislead.
A mortgage-focused bank naturally has different margins and loss rates from a credit-card lender. An investment bank has more fee and trading income. A transaction-heavy bank may carry large low-cost deposits and lower loan yields.
Peer comparison works best among institutions with similar asset mix, geography, customer base, and regulation.
What excellence looks like
A world-class analysis of bank financial statements links accounting to risk. It does not celebrate high ROE without examining leverage and capital. It does not celebrate low NPLs without checking vintages, restructurings, allowances, and growth. It does not assume a large deposit base is stable without checking concentration and pricing. It does not treat held-to-maturity securities as immune to rate risk or ignore off-balance-sheet commitments.
The strongest reader can reconstruct the bank’s business model from the statements: where money comes from, where it is deployed, how margin is earned, where losses could emerge, how much liquidity exists, and how much capital stands between an adverse scenario and failure.
That is the purpose of bank financial analysis. The statements are not merely historical records; they are a map of the institution’s risk-taking architecture.
<!-- MBA-DEEP-DIVE-END -->