Chapter 043: PD, LGD and EAD
Section 9: Credit Impairment and Expected Credit Losses · Chapter 043 of 100
1. Chapter opening
PD estimates default probability, LGD the loss conditional on default and EAD exposure at default. Many banks use these parameters with scenarios and discounting to estimate ECL. The measurement remains expected cash shortfalls: direct cash-flow or other suitable methods may also meet IFRS 9.
Twelve-month ECL includes lifetime shortfalls from defaults possible within 12 months; lifetime ECL considers defaults over the expected life. Marginal default probabilities, survival, recovery timing and drawdowns must be coherent. Under a deliberately simplified constant independent annual default probability p, n-year cumulative PD is 1-(1-p)^n. Real term structures need conditioning and migration evidence; that formula is not a mandatory conversion rule or a guaranteed margin above 12-month PD.
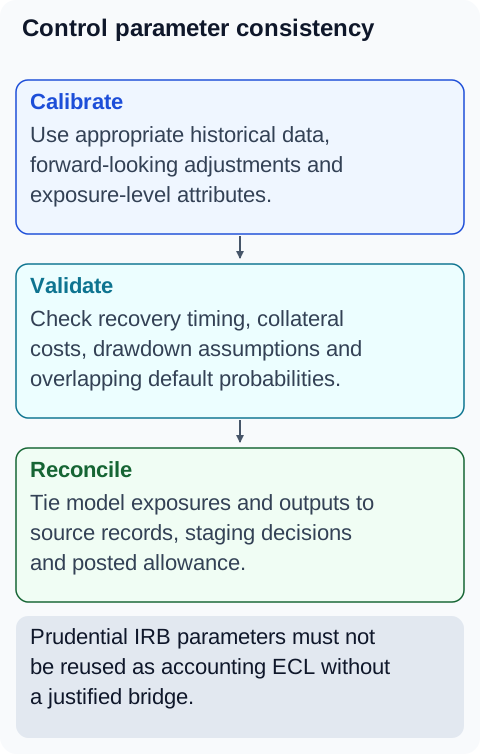
Accounting forward-looking parameters and regulatory IRB parameters have different objectives and calibrations. Explain their bridge rather than reuse a regulatory PD/LGD label without checking horizon, conservatism, default definition and discount timing.
2. Learning objectives
- Define PD (point-in-time vs through-the-cycle, 12m vs lifetime) with term-structure logic.
- Estimate LGD from collateral, costs, cure rates and discounting.
- Compute EAD with CCF for undrawn commitments and limit behaviour.
- Combine parameters with scenario weights and EIR discounting.
- Describe validation: back-testing, benchmarking, sensitivity and use-test.
- Convert 12-month PD to lifetime PD with term-structure methodology.
- Distinguish PIT from TTC PD and explain the reconciliation challenge.
3. Business context
PD models support credit decisions; LGD reflects collateral and recovery processes; EAD reflects expected exposure when default occurs. Their role in pricing and limits depends on bank policy. A 10bp rise in PD does not automatically require 10bp more customer interest: undiscounted expected-loss impact is approximately PD change×LGD×EAD, then funding, capital, costs and contractual constraints also matter.
Keep scenario relationships coherent: adverse employment can raise default rates while property stress reduces recovery and distressed borrowers draw revolvers. Combining independent average PD, LGD and EAD without checking dependence can understate loss. Through-the-cycle rating information may be useful, but the accounting measurement must reflect appropriate forward-looking conditions.
4. Finance and accounting view
4.1 A consistent calculation
Fictional pool drawn 500m, undrawn 250m, estimated CCF 10%: EAD=500+0.10×250=525m. Assume lifetime PD 4%, LGD 15%, all shortfalls at year 1.5 and EIR 4.5%. Base undiscounted ECL=4%×15%×525m=3.15m, not 31.5m. Upside ECL 2.10m at 20%, base 3.15m at 50%, downside 5.25m at 30% gives weighted 3.57m. Discount once:3.57/(1.045^1.5)=about 3.342m. These scenario losses and timing are fictional model inputs, not prescribed calibration.
4.2 PD term structure
Cumulative lifetime PD can be modelled from conditional period default rates. If a constant annual conditional PD is p, a simple illustration is 1-(1-p)^n. Real term structures can reflect changing hazards, survival, migration, prepayment and macro scenarios. Use marginal probabilities of default in each future interval to avoid applying cumulative PD repeatedly and double-counting default events. Remaining expected life may be less than 12 months; compare consistent horizons, not a universal required lifetime/12 month ratio.
4.3 LGD, EAD and discounting
LGD includes cash shortfalls conditional on default, collateral proceeds, timing, enforcement costs and recoveries. If LGD already includes discounted recovery cash flows at the correct valuation date, do not discount those same losses again. EAD includes expected amortisation, further drawdown, interest and fees where relevant; a term loan is not always static outstanding principal and a guarantee is assessed by its expected reimbursement/cash shortfall.
For fixed-rate instruments discount using original EIR or an approximation; for variable-rate instruments use the current EIR determined under IFRS 9. POCI uses credit-adjusted EIR; commitments and guarantees have their applicable discount rules. A floating-rate loan resetting from 4% to 6% does not universally keep 4% for ECL.
4.4 Accounting and prudential parameters
IFRS 9 uses reasonable/supportable forward-looking measurement, generally conditioned on current circumstances and probability-weighted outcomes. IRB uses its own long-run PD, downturn LGD, floors and permission rules. Do not import regulatory downturn conservatism into accounting without assessment or say accounting models require IRB approval/use-test. Reconcile objectives, populations, horizons, default definitions and calibration.
Validate rank-ordering, calibration and stability, but do not claim a universal 7-10 year data minimum for every ECL model. Data must be sufficient and relevant; external data and uncertainty adjustments can be necessary for low-default or new portfolios. Test predicted utilisation-at-default against actual draws and revised legal control of commitments.
5. Product and customer impact
Model estimates can influence product terms, approvals and pricing, but do not mechanically imply a universal LTV cap or spread. On 525m EAD and 15% LGD, a 10bp PD increase changes simplified undiscounted loss by 78,750. Customer decisions require explainability and applicable conduct/adverse-action requirements, separately from the accounting calculation.
6. Regulatory and supervisory view
Accounting ECL and regulatory IRB require their respective methods and governance. IFRS 9 does not require IRB permission to estimate losses, nor does IRB approval prove the accounting estimate is suitable. Data minima, downturn LGD, parameter floors and use-test requirements belong to the applicable prudential framework and scope.
Explain accounting/regulatory/stress parameter differences. Avoid duplicate loss recognition or overlay double counting, while retaining justified framework-specific conservatism. Stress models may start from rating information but need a documented transmission to scenario-sensitive defaults, recoveries and utilisation.
7. Systems and data view
Version ratings, recovery data, collateral prices/costs, cash-flow timing, utilisation/CCFs, economic scenarios and models. Reconcile exposure and undrawn commitments to source ledgers before calculating. Value collateral at appropriate current information; review frequency follows risk and applicable requirements, not a universal annual IFRS rule.
Each output should identify its parameter version, scenario weight, horizon and discount valuation date. Validate discrimination, calibration, stability and sensitivity appropriately. Track overrides and backtest recoveries, not just PD grades; an accurately ranked borrower population can still have materially biased loss estimates.
8. End to end process
- Rate obligor, value collateral, measure utilisation. 2. Derive PIT PD/LGD/EAD with scenario conditioning. 3. Calculate ECL, discount, weight. 4. Post allowance with parameter lineage. 5. Monitor realisations vs predictions. 6. Validate, recalibrate, re-version on cycle.
9. Controls and risks
| Risk | Control | Evidence |
|---|---|---|
| Grade inflation | Override monitoring, distribution analytics | Override reports, grade migration |
| Stale collateral | Revaluation cycles, haircut reviews | Valuation logs, haircut papers |
| CCF underestimation | Utilisation-at-default studies | CCF validation packs |
| Unexplained reg-vs-acct gaps | Difference attribution, documented add-ons | Reconciliation memos |
| PD term-structure error | Lifetime vs 12-month consistency checks | Term-structure validation |
| Scenario-weight miscalibration | Economic rationale documented, Board-approved | Scenario-weight packs |
10. Practical examples
Fictional collateral stress: a collateral price falls 15%. Recalculate recoverable proceeds after costs, timing and enforceability, then LGD. The resulting ECL change is not universally 40%; it depends on the whole exposure and loss model. Assess SICR from default-risk information independently of the collateral-driven LGD change.
Fictional drawdown: undrawn facility 100m had a 25% CCF assumption, giving 25m expected additional drawings. Supported stress evidence indicates 70%, giving 70m: EAD rises 45m before amortisation or other changes. At 4% PD and 15% LGD, simplified undiscounted expected loss rises 270,000. Recalibrate using segment evidence and coherent PD/LGD scenarios rather than simply apply the same CCF to every product.
11. Diagrams
Figure 1. PD, LGD and EAD are model inputs.
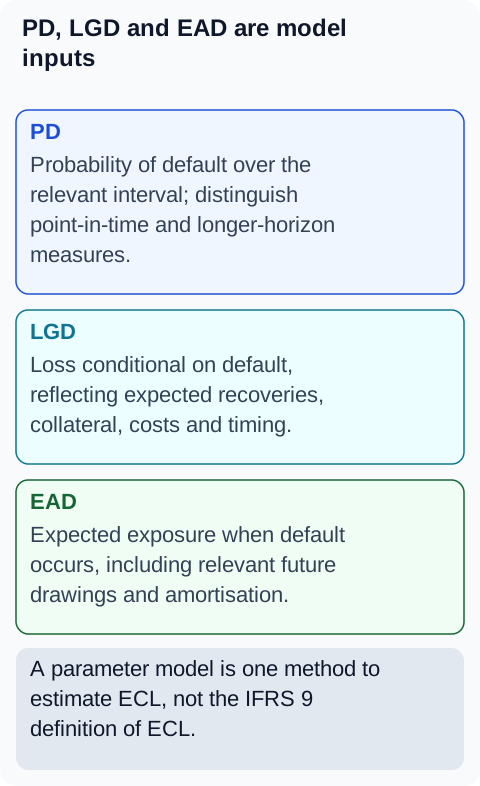 Figure 2. A simplified discounted loss example.
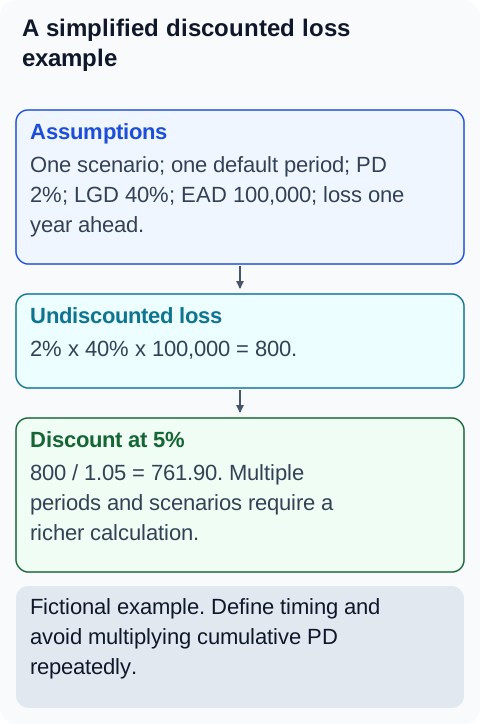 Figure 3. Control parameter consistency.
12. Tables
Table 1 — Parameter sources
| Parameter | Retail | Wholesale |
|---|---|---|
| PD | Scorecards, roll-rates | Grades → master scale |
| LGD | Collateral indices, cure stats | Facility analysis, workout history |
| EAD | Balance + behavioural CCF | Limit structure, product CCF |
Table 2 — PIT vs TTC
| Lens | Use | Behaviour |
|---|---|---|
| Point-in-time | ECL provisions | Moves with cycle |
| Through-the-cycle | Rating stability, appetite | Smooth across cycle |
| Reconciliation | Explained differences | Documented, tested |
13. Illustrative bank case study
Fictional bank scenario. Collateral information is stale while property values and borrower cash flows deteriorate. Risk updates recoverable proceeds and LGD, then separately assesses SICR from default-risk information. Higher LGD alone is not the definition of SICR. The bank records supported loss changes and reviews the missed data feed. This training case does not assert an event at an unnamed real institution.
14. BA, developer, tester and operations guidance
- BA: Specify parameter sources, horizons, scenario transmission and validation metrics per portfolio.
- Developer: Version models and inputs; lineage every ECL number to parameters; automate back-test feeds.
- Tester: Recompute ECL independently on samples; stress inputs to extremes; verify scenario weights sum to 100%.
- Operations: Monitor overrides, valuation freshness and utilisation anomalies as parameter-health KPIs.
15. Common mistakes
- Using TTC PDs directly in PIT ECL without conditioning.
- Gross collateral values without haircuts, costs and timelines.
- Static CCFs ignoring stress drawdown behaviour.
- Undocumented differences between regulatory and accounting parameters.
- Models validated once, never again.
- PD term structure assumed flat rather than derived from migration matrices.
- Scenario weights assigned without economic rationale.
16. Key takeaways
- A PD/LGD/EAD implementation combines scenario-dependent losses and appropriate discounting; alternative suitable cash-shortfall methods may also meet IFRS 9.
- Horizons matter: 12-month vs lifetime, PIT vs TTC.
- Collateral freshness and CCF realism decide LGD/EAD honesty.
- Validation and monitoring use backtesting, benchmarks and sensitivity; prudential use-test obligations are separately scoped.
- Differences between frameworks must be attributed, never assumed.
- The term structure of PD must be validated, not assumed.
- Behavioural EAD captures borrower distress responses that contractual terms miss.
17. References and verification notes
- IFRS 9 impairment
- BCBS ECL guidance
- Basel IRB definitions and estimation
- Rules are applied under the reporting entity's adopted accounting framework and jurisdiction. Basel standards require local implementation; they are not themselves national law. All unnamed cases, amounts and operational thresholds are fictional training examples.