Chapter 063: Customer, Product and Channel Profitability
Section 13: Management Finance and Bank Profitability · Chapter 063 of 100
This chapter explains customer, product and channel profitability from the reporting bank's perspective. Examples are fictional; accounting follows IFRS unless another framework is expressly identified.
1. Chapter opening
Customer, product and channel profitability attributes the bank's revenues, funding costs, credit costs and operating resources to management views. These views support decisions but must reconcile to approved financial results. A customer, product and channel may describe the same transaction; adding their totals together double-counts it.
2. Learning objectives
- Build consistent customer, product and channel contributions.
- Allocate shared costs using transparent causal drivers.
- Distinguish full-cost profit, incremental contribution and risk-adjusted return.
- Reconcile management adjustments to the GL without duplicating credit or funding costs.
3. Business context
A customer may hold deposits, a mortgage and a card, using a branch for advice and an app for servicing. Product economics measure each contract; relationship economics aggregate the customer's contracts; channel economics assess acquisition and service resources. Each view answers a different decision and must preserve the same bank total.
4. Finance and accounting view
4.1 Revenue and resource attribution
Map effective-interest revenue and expense to the contract, applying the accounting basis before management attribution. Some origination fees are part of the financial instrument's EIR; service fees in IFRS 15 scope follow the relevant performance obligations. Cash fees collected are not automatically current profit. Deposit FTP credits and loan FTP charges attribute funding value and cost without creating bank-wide income.
Direct costs follow identifiable activities. Allocate shared operations, technology and premises using explained drivers such as transactions, accounts, support effort or capacity. Revenue-based allocation is convenient but may not reflect cost causation. Unused capacity and corporate costs may remain central; show them explicitly so the bank total still reconciles.
4.2 Credit and capital
Reported profitability uses the actual accounting impairment charge. A prospective pricing view may replace it with a normalised annual expected-loss assumption, with a bridge; subtracting both without explanation double-counts credit cost. A management capital charge is not an extra statutory expense. State whether allocated capital is regulatory or economic and whether the return measure is before or after that charge.
4.3 Channel and decision economics
Give each revenue item one primary attribution or an approved split. A branch adviser, digital application and contact-centre support can jointly serve one customer; multi-touch attribution shares one revenue amount rather than crediting the whole amount to every channel. Assess full cost for long-term capacity decisions and incremental avoidable cost for near-term decisions. A loss after arbitrary overhead allocation does not prove closure will improve bank profit.
Climate, conduct and concentration risk can affect expected losses, demand and future service costs. Include supported estimates and scenarios. No universal green risk-weight discount or automatic transition-profit premium follows from a management segment label.
5. Product and customer impact
Relationship pricing should consider the customer's complete needs and costs without using profitability as a reason to weaken affordability, fair treatment or service obligations. Cross-sell forecasts need actual customer demand and lawful data use; assumed future revenue is not booked income.
6. Regulatory and supervisory view
IFRS 9 informs interest and impairment accounting; IFRS 15 informs service revenue in its scope. FTP guidance addresses the funding attribution. Management profitability definitions are bank policy, not an IFRS mandated customer ranking or prudential risk-weight exemption.
7. Systems and data view
Link contract IDs to customer and channel identifiers with controlled hierarchies and effective dates. Record revenue attribution, activity costs, allocation pools, FTP versions and reconciliation residuals. Privacy and access controls matter where analysis combines customer data. A channel change must not silently rewrite historical attribution.
8. End to end process
- Reconcile contract revenue and actual costs to the GL.
- Apply equal internal FTP allocations.
- Attribute direct costs and approved shared-cost drivers.
- Aggregate separate customer, product and channel views.
- Bridge actual to normalised/risk-adjusted results.
- Test demand, avoidable costs and constraints before changing services.
9. Controls and risks
| Risk | Control |
|---|---|
| Revenue credited to several channels | Attribution weights sum to 100% |
| ECL and expected loss both deducted | Actual-to-normalised bridge |
| Shared costs disappear | Allocation-pool reconciliation |
| Small customers inherit arbitrary losses | Driver sensitivity and central-cost transparency |
| Forecast cross-sell booked as profit | Separate scenario and actual results |
10. Practical examples
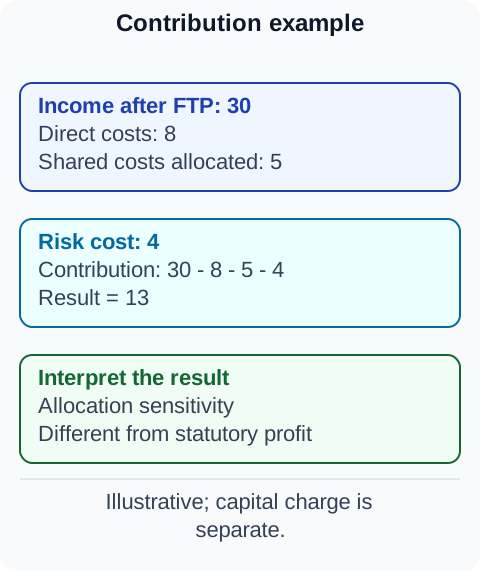
A fictional relationship earns loan interest 55, pays loan FTP 42, earns service fees 8 and receives deposit FTP 9. Customer deposit interest is 5, direct service costs 6, allocated shared costs 4 and actual impairment 3. Profit contribution is 55 - 42 + 8 + 9 - 5 - 6 - 4 - 3 = 12. A normalised view replacing impairment 3 with expected loss 2 shows 13, with a +1 bridge; deducting both would incorrectly show 10. If capital allocated is 100 and all amounts are annual, pre-tax return on that capital is 12%.
11. Diagrams
Figure 1. Customer profitability.
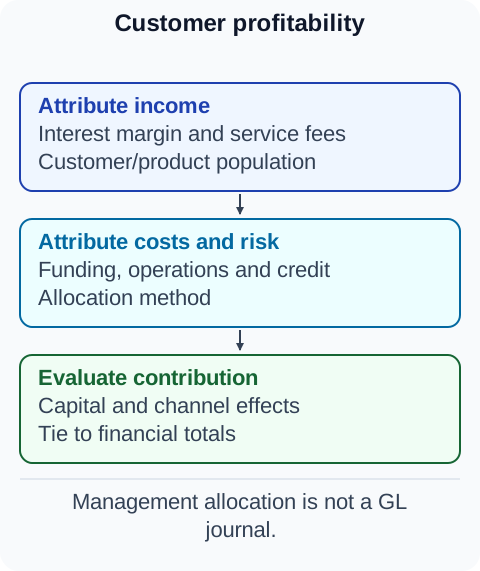 Figure 2. Profitability cost layers.
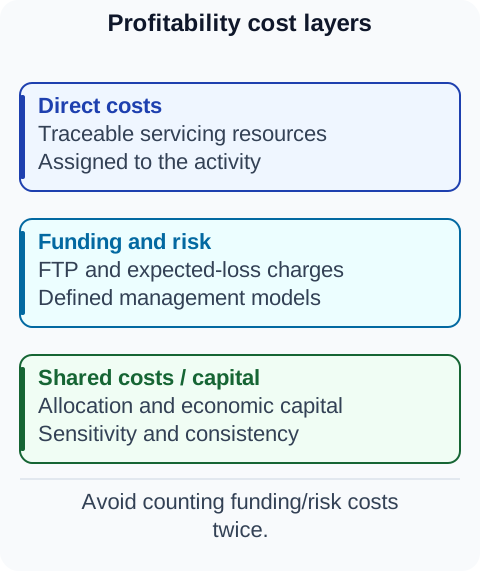 Figure 3. Contribution example.
12. Tables
| View of the same service-fee revenue | Attributed amount |
|---|---|
| Total fee | 8.0 |
| Branch 40% | 3.2 |
| Digital 50% | 4.0 |
| Contact centre 10% | 0.8 |
The channel split totals 8.0. It must not be added to the relationship's 8.0 again.
13. Fictional banking case study
A fictional bank labelled its branch customers unprofitable after allocating every central technology cost to branches. Review found the app depended on the same platform and closure would not remove most costs. The bank rebuilt activity drivers and assessed incremental savings, migration costs and customer impact before deciding which capacity to change.
14. BA, developer, tester and operations guidance
FTP supplies funding allocations. Performance measures define the return denominator. Pricing converts expected revenues, losses and resource use into a prospective hurdle decision; budgeting aggregates scenarios to bank totals.
15. Common mistakes
- Adding customer, product and channel revenue totals together.
- Treating all collected fees as immediate revenue.
- Double-counting impairment and normalised expected loss.
- Treating allocated overhead as fully avoidable cash cost.
- Using a management capital charge as a statutory journal.
16. Key takeaways
Attribution should explain bank economics without creating revenue or hiding cost. Keep views separate, reconcile them to the GL and use the cost and risk basis appropriate to the decision.