Chapter 064: Budgeting, Forecasting and Variance Analysis
Section 13: Management Finance and Bank Profitability · Chapter 064 of 100
This chapter explains budgeting, forecasting and variance analysis from the reporting bank's perspective. Examples are fictional; accounting follows IFRS unless another framework is expressly identified.
1. Chapter opening
A budget sets an approved plan; a forecast updates the expected outcome using current information. Variance analysis explains why actual results differ from each version. Banking forecasts link profit, balance sheets, liquidity, capital and operational capacity rather than project earnings in isolation.
2. Learning objectives
- Build forecasts from volumes, prices, mix and risk assumptions.
- Distinguish profit variance from RWA and capital-ratio variance.
- Preserve original forecasts while producing controlled updates.
- Test sensitivities and management actions without assuming certainty.
3. Business context
Loan growth changes interest income, funding needs, expected losses and capital. Deposit repricing may lag asset repricing; hedge maturities and behavioural assumptions affect NII. Plan at the appropriate entity/currency level so consolidated profit does not hide a local funding or capital constraint.
4. Finance and accounting view
4.1 Driver-based forecast
Project opening balances, new business, repayments, defaults, write-offs and FX to closing balances. Use appropriate average balances for interest, contractual and behavioural repricing for yields, and consistent scenarios for funding, ECL and customer behaviour. Fees require volume and recognition assumptions; expense plans distinguish recurring costs from investments, depreciation and restructuring obligations.
4.2 Capital and variance attribution
Capital ratios have both numerator and denominator effects. Opening CET1 of 7.2 on RWA of 60 gives 12.0%. Retained profit of 0.2 increases CET1 to 7.4; RWA growth to 62.4 then gives 11.859%. This is not calculated by subtracting a fixed percentage-point penalty for RWA growth. A requirement increase changes headroom, not reported CET1 or the ratio numerator.
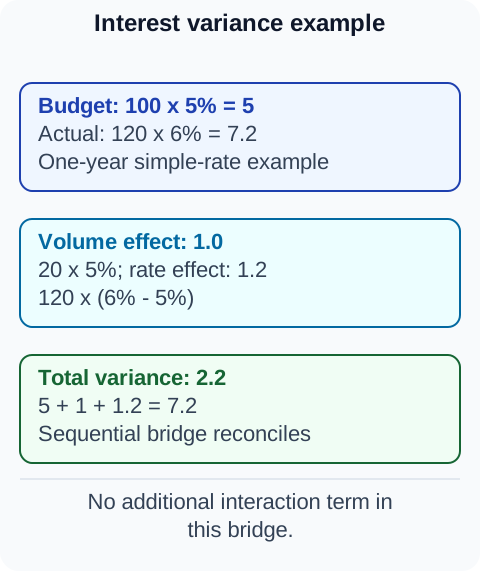
Split revenue changes into volume, price and mix using an agreed sequence and disclose any interaction residual. Reconcile projected accounting equity to regulatory capital with deductions, OCI filters and instrument eligibility. Do not equate forecast profit with cash inflow or unrestricted capital transfer capacity.
4.3 Forecast governance
Keep the approved budget and original forecast immutable for performance assessment. Publish revised forecasts as new versions with assumptions and change bridges. Back-testing distinguishes bias, random variation and model weakness. Bank-policy alert thresholds, such as 5 basis points or 10% variance, are not universal supervisory rules.
5. Product and customer impact
Forecasting must reflect customer rates, affordability and service capacity. An assumed ability to increase fees or reduce deposit rates may be constrained by contracts, competitive behaviour and local requirements. Link growth plans to staffing, underwriting quality and systems capacity.
6. Regulatory and supervisory view
ECB SREP considers business models, governance and capital/liquidity risks; it does not impose a universal forecast-accuracy band or automatic capital add-on for missing one. IAS 8 distinguishes estimates from accounting errors. A new forecast is not a retrospective rewriting of an already issued financial statement.
7. Systems and data view
Use one assumption catalogue with scenario, period, owner and approval. Align finance, risk and treasury extracts to the same opening date. Track model versions, manual overlays and action dependencies. Preserve detailed drivers so a reviewer can reproduce a movement without an unexplained top-line plug.
8. End to end process
- Reconcile opening actuals.
- Set base and adverse economic assumptions.
- Project volumes, income, expenses and risk costs.
- Build cash, balance-sheet and capital bridges.
- Challenge assumptions and management actions.
- Approve a version and analyse subsequent actual variance.
9. Controls and risks
| Risk | Control |
|---|---|
| Inconsistent economic scenarios | Shared assumptions and cross-function review |
| Profit without funding capacity | Liquidity and entity-balance-sheet proof |
| Double-counted capital actions | Amount-based capital bridge |
| Original miss hidden by update | Retained original and revised versions |
| Optimistic action timing | Execution, cost and approval dependencies |
10. Practical examples
Illustrative RWA budget versus actual, in billions:
| Portfolio | Budget | Actual | Difference | Difference / budget |
|---|---|---|---|---|
| Retail | 27.0 | 28.2 | 1.2 | 4.44% |
| Corporate | 23.0 | 24.8 | 1.8 | 7.83% |
| Markets | 10.0 | 9.4 | -0.6 | -6.00% |
| Total | 60.0 | 62.4 | 2.4 | 4.00% |
Investigate volume, credit migration, collateral, model/rule changes and FX. A total favourable movement in one book does not cure an unsupported assumption in another.
11. Diagrams
Figure 1. Planning and forecasting.
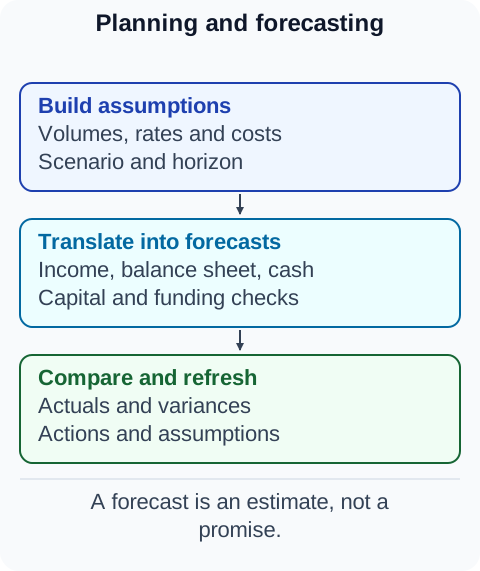 Figure 2. Variance attribution.
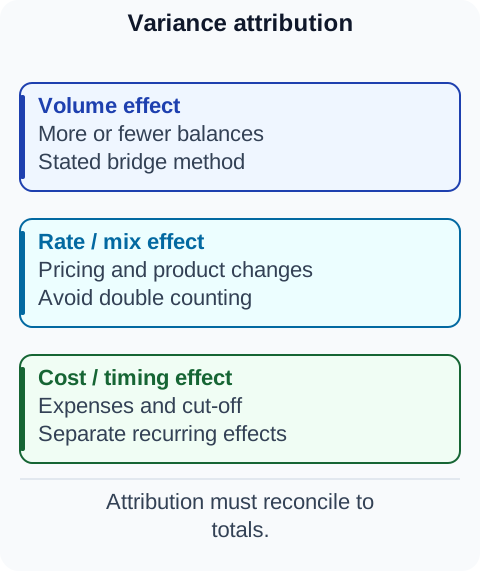 Figure 3. Interest variance example.
12. Tables
| Forecast component | Balance-sheet/capital link |
|---|---|
| Loan growth | Funding, RWA, ECL and service capacity |
| Retained profit | Equity and eligible capital, after adjustments |
| OCI | Equity with relevant prudential filters |
| AT1 issuance | AT1/Tier 1 eligibility, not CET1 |
| CCyB increase | Requirement/headroom, not a capital expense |
13. Fictional banking case study
A fictional bank missed its corporate RWA forecast because credit migration was omitted. Finance preserved the original forecast, added risk-rating migration to the next version and quantified the effect on headroom. The bank assessed distributions using the revised outlook; it did not retrospectively alter the approved budget to eliminate the miss.
14. BA, developer, tester and operations guidance
Performance measures explain results; FTP helps forecast business margins. Stress testing challenges the outlook, while capital planning assesses feasible actions and regulatory requirements.
15. Common mistakes
- Forecasting NII without repricing and average balances.
- Applying requirement changes as capital losses.
- Adding percentage-point capital effects without a consistent ratio bridge.
- Treating every forecast miss as an accounting error.
- Assuming optimistic future actions are already executed.
16. Key takeaways
A useful forecast is coherent, reproducible and versioned. Explain variance through actual drivers and test capital and funding effects before translating a profit plan into growth or distributions.