Chapter 061: Bank Performance Measures
Section 13: Management Finance and Bank Profitability · Chapter 061 of 100
This chapter explains bank performance measures from the reporting bank's perspective. Examples are fictional; accounting follows IFRS unless another framework is expressly identified.
1. Chapter opening
Performance measures connect reported results to the resources used to earn them. Define numerator, denominator, averaging method, scope and period before comparing banks or business lines. Accounting equity, CET1, RWA and the leverage exposure measure are different quantities.
2. Learning objectives
- Calculate ROE, ROA, NIM, cost-to-income and return on RWA.
- Reconcile measures to financial statements and management adjustments.
- Explain denominator effects and compare consistent bases.
- Separate performance, capital headroom and liquidity capacity.
3. Business context
A high ROE may arise from strong earnings or low equity. A low cost-to-income ratio may reflect volatile trading income rather than sustainable efficiency. Assess credit costs, funding resilience, concentrations and capital constraints alongside the headline measures. None of these ratios alone establishes a sound business model.
4. Finance and accounting view
4.1 Definitions
ROE = net income attributable to the relevant shareholders / average corresponding accounting equity. ROA = net income / average assets, using consistent scope. On the same basis, ROE = ROA × average assets/average equity. NIM = net interest income / average interest-earning assets. Cost-to-income = defined operating expenses / defined operating income. Return on RWA = the specified profit measure / average RWA. Publish any exclusions and annualisation conventions.
CET1/RWA is a regulatory capital ratio, not equity/assets. RWA/assets is risk-weight density, not accounting leverage. The Basel leverage ratio uses Tier 1 capital and the regulatory exposure measure, not book equity and GL assets.
4.2 Worked bank metrics
Assume annual net interest income 2,250, fees 750, operating costs 1,800, impairment 400 and tax 200: net income is 600. Average assets are 100,000, earning assets 90,000, ordinary equity 8,000 and RWA 45,000. There are no preferred distributions, minority interests or other adjustments.
| Measure | Calculation | Result |
|---|---|---|
| NIM | 2,250 / 90,000 | 2.50% |
| Cost-to-income | 1,800 / 3,000 | 60.00% |
| ROA | 600 / 100,000 | 0.60% |
| ROE | 600 / 8,000 | 7.50% |
| Return on RWA | 600 / 45,000 | 1.33% |
| RWA density | 45,000 / 100,000 | 45.00% |
4.3 Growth and comparison
A 12% ROE with 50% earnings retention grows equity by 6%, before OCI, issuance and other changes. If capital ratios, risk density and equity-to-capital adjustments remain constant, sustainable assets and RWA also grow by 6%; dividing that rate by 45% density does not create 13.3% growth capacity.
Business A earns 320 on equity 2,000 and RWA 9,000: ROE 16%, return on RWA 3.56%. B earns 330 on equity 3,000 and RWA 6,000: ROE 11%, return on RWA 5.50%. The ranking changes because allocated equity and RWA differ. Return on RWA does not capture every economic risk, liquidity constraint or marginal return, so it cannot independently determine where to allocate new capital.
5. Product and customer impact
Product service quality, customer outcomes and resilience constrain profitable growth. A channel that appears costly after central overhead allocation may still make a positive incremental contribution. Removing it requires a demand, service and avoidable-cost assessment.
6. Regulatory and supervisory view
IAS 1 provides the statutory reporting basis; alternative performance measures need transparent definitions. Basel capital standards distinguish regulatory capital from accounting equity. For ECB-supervised banks, SREP evaluates business-model sustainability alongside governance, capital and liquidity. There is no universal supervisor-approved target NIM, ROE or risk-weight density.
7. Systems and data view
The metric catalogue records owner, calculation, GL mapping, adjustment policy and denominator frequency. Use monthly or daily averages where appropriate; period-end denominators can distort rapidly growing or seasonal books. Retain both reported and adjusted series with bridges rather than rewrite history.
8. End to end process
- Reconcile income and expense to approved accounts.
- Select consistent average resources and attribution basis.
- Calculate measures and explain material movements.
- Separate price, volume, mix, credit-cost and denominator effects.
- Compare peers only after accounting and scope adjustments.
- Check capital, liquidity and customer constraints before action.
9. Controls and risks
| Risk | Control |
|---|---|
| Equity/CET1 confused | Distinct denominator labels and bridges |
| Volatile income flatters efficiency | Recurring-income analysis alongside reported ratio |
| Allocation changes drive rankings | Stable methodology and change bridge |
| Period-end denominator bias | Appropriate average and sensitivity |
10. Practical examples
If the fictional bank's net income remains 600 but average equity rises from 8,000 to 10,000, ROE falls from 7.5% to 6.0%. This is a denominator change, not a 20% decline in profit. If NII rises 90 while earning assets remain 90,000, NIM rises by 90/90,000 = 0.10 percentage point, or 10 basis points.
11. Diagrams
Figure 1. Build a performance ratio.
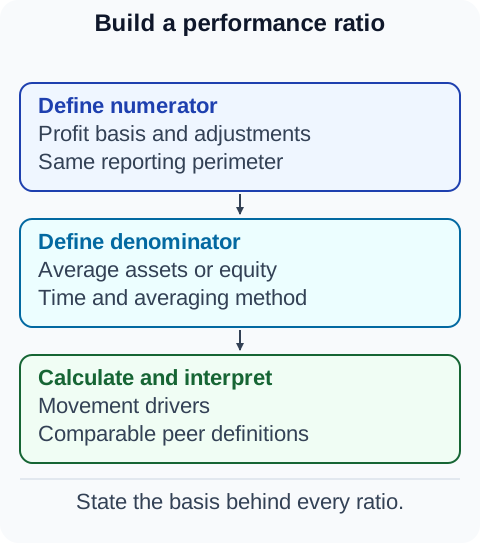 Figure 2. Bank performance measures.
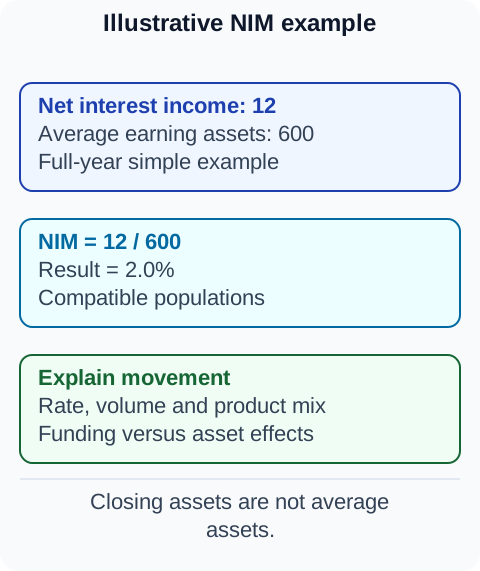
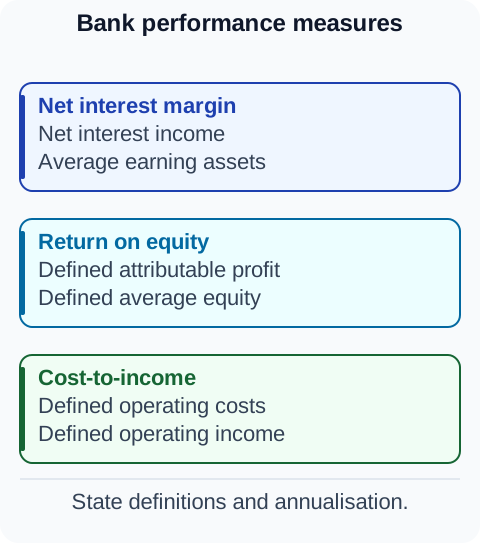 Figure 3. Illustrative NIM example.
12. Tables
| Question | Suitable starting measure | Further checks |
|---|---|---|
| Shareholder return | ROE | Equity adequacy and distributions |
| Asset earnings | ROA | Mix, credit costs and scope |
| Intermediation margin | NIM | Interest-rate and funding composition |
| Operating efficiency | Cost-to-income | Revenue volatility and service quality |
| Prudential resource return | Return on RWA | Model rules, liquidity and economic risk |
13. Fictional banking case study
A fictional bank rewarded business lines on ROE alone. One line improved its score after its allocated equity was reduced, although its revenue and losses were unchanged. Management introduced an allocation bridge and reviewed returns with risk, liquidity and customer measures before changing growth limits.
14. BA, developer, tester and operations guidance
FTP attributes funding economics; customer profitability allocates revenues and costs. Pricing uses prospective risk-adjusted returns. Capital planning tests how retained earnings and growth affect actual capital ratios.
15. Common mistakes
- Using NIM as a net-profit margin.
- Substituting CET1 for accounting equity in ROE without relabelling.
- Inferring binding capital constraints from raw basis-point headroom alone.
- Turning retention growth into asset capacity by dividing by density.
- Treating RORWA as a complete measure of economic risk.
16. Key takeaways
State exactly what each measure includes. Reconcile numerator and denominator, explain changes in both and assess constraints before translating an attractive ratio into a business decision.
17. References and verification notes
-
Basel CAP30 regulatory adjustments: current international deduction framework, including goodwill/intangibles and DTA rules; domestic implementation determines a bank's enforceable requirements.
-
IAS 1: reporting basis.
-
Basel capital definitions: regulatory capital distinction.
-
ECB SREP: multi-dimensional supervisory assessment.
-
All metrics and peer examples are fictional; no real-bank ranking or rating methodology is asserted.